


This is a guide to our Organic Growth Impact Tool, and how to use it. Before you read on, we highly recommend downloading your own copy here.
Most strategic marketing decisions are taken with the support of data, and mobile growth marketing is no different. Our Organic Growth Impact Measurement Tool uses the student’s t-test to gain insights into the impact on organic growth your marketing efforts might have, using the variation in downloads between weekends or weekdays as a jumping off point.
The Tool is valuable because if you are a mobile marketing manager, or work for one, you most likely have been required to supply data that demonstrates the impact of your paid marketing efforts on organic downloads at some point. However, this task is far from simple, because the relationship between paid marketing and organic downloads cannot be observed directly. Moreover, one can rarely control for all the variables. Time and speed are also essential, as waiting for additional data can slow down the decision-making process. Marketing managers therefore need to measure the effects of changes as soon as possible.
What is the student’s t-test?
The student’s t-test looks at differences between means of two distributions (in our case, downloads before and after a certain event, such as a marketing campaign) and takes variance into account to test whether there is a significant difference between the means.
If statistical significance is not reached one might need more data to increase the power of the t-test, but such data might not be available. What other options do we have here? You could ask for more budget and time to run your campaigns until you have enough data to reach statistically significant results; or you could run your campaigns and hope for the best outcome.
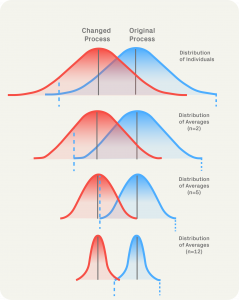
This article introduces a third path, of using the insight given by variations in download behavior over the course of a week. Although a t-test can be used with relatively little data, it is harder to observe impact when there is a high variance. If this is the case, then comparing the before and after of a marketing event within weekends and within weekdays separately can reduce the variance in the distributions tested. This allows us a bit more visibility on the effects of an event such as a marketing campaign on organic growth.
For example, in the Photo and Video category on iOS, apps tend to be downloaded more over the weekend. This observation is based on apptweak data over a sample of ~20 random apps over 2021 and 2022, of which nearly all had a statistically significant difference between weekend and weekday downloads. Weekend and weekday downloads numbers were compared in a paired t-test.
You can check if this is the case for your app by using a paired t-test on the number of daily downloads during a week (average over weekdays), and the number of daily downloads during the weekend (average over Saturday and Sunday). Testing on a weekend Vs weekday, keeping the pairing within a week, will help determine if there is a meaningful difference in download behavior between different parts of the week.
If there is, then you can use the following tool to also split the weekend and weekday (or any other group of days) in the before/after test. This option helps us overcome the lack of data when we want to measure the impact of marketing effort on organic downloads. It is important to consider if the organic downloads from the app are behaving in a certain pattern, it is possible to group the different days of the week (for instance weekdays/weekends) and measure the cluster effect that each group has on the organic growth of your app.
Introducing the Organic Growth Measurement Tool
We developed the ‘Organic Growth Impact Measurement Tool’ to help mobile marketers understand and measure the impact a certain event (e.g a new brand campaign, a new feature in the app, a change of the optimization method), might have on the organic downloads of that app.
How to use
This tool was aimed to create a clear and easy way to understand the effect of campaigns on organic growth. Its graphs and traffic lights marks are designed to give a quick view form the impact the camping has. Below please find the easy 5 steps for using the tool.
Simply download the tool via this link here, and follow the steps below.
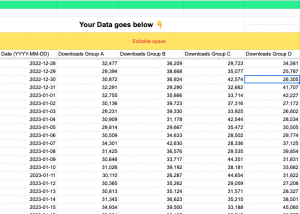
Step 1: Paste your Organic download data in the ‘1. Data (User Input)’ tab, your data must be populated daily Please only pasted it into the highlighted area.
Step 2: Go to the tab “2. Setup”, in here select the exact day you want to define as the Date of implementation; remember in order for this t-test to work, the sample must have the same number of days. A suggested midpoint suggestion has already been settled as default.
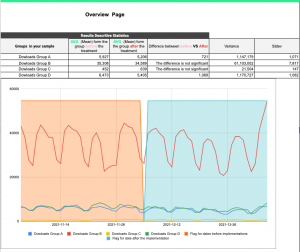
Step 3: After all the check marks are in green proceed to analyze your data on the right side of the ‘3. Overview (T-test result )’ tab the descriptive statistics from each of the groups the user added.
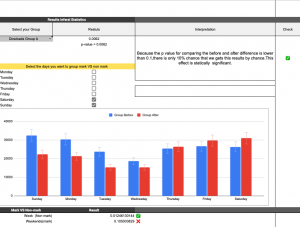
Step 4: If you have added more than one group you can check the result of the general t-test and the t-test for the two groups (week and weekends). It is possible to change the group in cell I9.
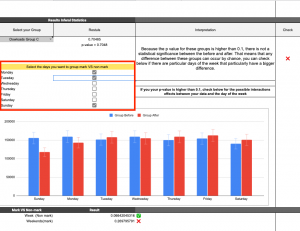
Step 5: Not all app downloads behavior during the week. It might be that for some apps the spikes of days should be on long weekends (Friday, Saturday, and Sunday). For this reason, the user can mark (or not mark) the set a particular day to include in the comparison that needs to be made.
Tool and t-tests limitations
The main limitation of a t-test is the amount of data that is provided. When there is more than N data points, the data does not need to be normally distributed (the means should be normally distributed). When there is too little data, the result may not be reliable.
- The Organic Growth Impact Measurement Tool is using a two tail t-test which is why it requires the same amount of days for the groups before and afterward.
- The Organic Growth Impact Measurement Tool supports a maximum of four groups to test (displayed as Groups A, B, C, D).
- The split of the days in the example shows weekends and weekdays in different groups, but any days can be marked. If different groupings of days are applicable to the app, the tool supports that.
Final Considerations
In order to measure the indirect effect between marketing efforts and organic growth from an app it is essential to consider control variables and ‘pick’ the correct test.
Control variables. When testing the effect of X on Y, we are actually hypothesis testing. It is essential to gather enough evidence to prove or refute our hypothesis. Control variables are required because it is the only possible way to explain that the observed effect upon Y was caused by X, and it didn’t occur by chance. Control is allowing the test to systematically eliminate (or reduce) the factors that are not tested (exogenous variables such as macroeconomic events in a particular market or a different marketing campaign). By using the idea of grouping weekdays and weekends (weekdays and weekends can be modified depending on the business nature), we are reducing a potentially high variance in the data set by splitting the part that we know has a lot of variances. Basically, we are reducing the variance through business knowledge
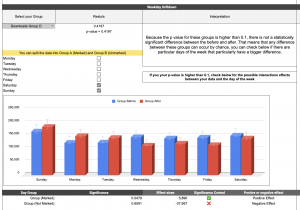
Pick the correct test. This is one of the most crucial steps required when testing a hypothesis. Usually, the type of test mostly depends on the experiment design one has chosen and the type of hypothesis that needs to be tested. We use a t-test and split it by day-group. In the Organic Growth Impact Measurement Tool, there is some (synthetic) example data that you can explore; as in the image below, the dataset D has an impact on the marked days (weekends) but not unmarked (weekdays). Without the split, there is no significant difference, but there is one with the split. In this case, perhaps the change or event particularly affected users who search for this kind of app on the weekend.
Note
This tool uses a type 2 t-test available in Google Sheets which means: a two-sample equal variance (homoscedastic) test is performed. This means that this test should be performed only when the time “before” and “after” the groups the user is comparing follow a similar pattern. Moreover, the tool is using a two-tail t-test which establishes that we are not measuring if 𝒎 before is smaller than 𝒎 after but rather if there is a significant difference between them.
It is important to mention that one can make as many comparisons and rearrange to make differences between group significance, but it does always mean we should. With more testing, you might overestimate the impact. We recommend using this tool to test a salient hypothesis about how a campaign or other change may affect different days (weekends or weekdays) differently, especially if there is difference in organic behavior across such a split in days.
Before you go
- Looking to run surveys to understand user behavior better? Check out our article on how to structure user research to yield actionable insights.
- Media Mix Modeling is in vogue given the privacy constraints upon tracking. MMM works by matching spikes and dips in sales to events and actions in marketing, in order to estimate performance using aggregate data only. Check out our article outlining the data you need to estimate performance with Media Mix Modelling.
- Phiture can help your app or game tighten up on understanding your numbers. Want to find out more? Reach out to us here.
Table of Contents