
This is a guest post about Media Mix Modeling (MMM) for the Mobile Growth Stack, from Mike Taylor formerly at Ladder where he worked with Monzo Bank and Michael Kaminsky at Recast. MMM falls under Predictive Models under Growth and Insights in the Mobile Growth Stack and is experiencing a resurgence in popularity following Apple’s iOS14 update which limits user tracking. Here Mike and Michael take us through best practices for this increasingly popular area of attribution.
Media Mix Modeling
Post iOS14, marketers no longer have comprehensive user-level data, so privacy-friendly methods like Media Mix Modeling have seen a resurgence in popularity. MMM works by matching spikes and dips in sales to events and actions in marketing, in order to estimate performance using aggregate data only. It’s a holistic approach, which works with offline data as well as digital data, so is essential for mobile advertisers who have ‘graduated’ to TV ads or other hard-to-measure channels. The advantage of MMM is its ability to establish incrementality independent of what the platforms report, and make predictions on what performance would look like if you scale ad spend. MMM also holds the promise of being able to tell us how much external factors like app store ranking, COVID, or the economy, impact the number of app installs we acquire.
Modern tools can make using this complex technique more efficient and even real-time, and it is particularly useful for informing large-scale, cross-budget decisions. Investment in this area by Facebook, Google, and a host of new vendors like Recast that are modernizing this process, is paying off, and making real-time model updates possible. However, the majority of brands using this method still carry it out on a quarterly or yearly basis, as modern practices have yet to be universally adopted. Using probabilistic methods like MMM requires a mindset shift: rather than bottom up, campaign, and creative level data, you’re working from the top down and can’t get as granular. Before worrying about fancy machine learning algorithms, getting all of your data in one place and in the right format is typically 60% of the work, and that’s the place to start, before worrying about fancy machine learning algorithms.
Who is MMM for?
Much has been written about Media Mix Modeling in the wake of Apple’s iOS14 update, which saw users opting out of tracking in droves. However, mobile app marketers could be forgiven for being lost on where to start with the technique, as the majority of content is geared towards the Consumer Packaged Goods (CPG) or retail industries. The good news is that MMM is well suited to mobile apps, so long as you know what data is needed. It even works well for smaller apps which don’t have much data. That’s because it uses time series data, so all companies big and small have the same number of observations (days or weeks) to feed into the model (though the amount of variance between data points is also important).
The technique was developed in the 1960s, as a way of using linear regression to model the impact of various strategic and tactical decisions made in relation to the marketing mix. There were no digital ads back then, so there were none of the benefits of digital tracking. The technique was developed as a top down approach to setting budgets across channels that worked holistically across every marketing channel. It became more important in the light of the Enron scandal, as Section 404 of the Sarbannes-Oxley Act dictated that all public companies must provide justification for large expenditures. Thus, marketing was suddenly accountable.
The major benefit of MMM is that it doesn’t require user level data, so it has become incredibly popular for companies that can no longer track users effectively after Apple’s iOS14.5 update. It takes aggregate data on your marketing spend, press mentions, and app store ranking, and matches spikes and dips in those variables to the number of app installs you received. Rather than linear regression in Excel, most modern practitioners use advanced machine learning or Bayesian methods to determine what share of sales each channel drove. Because it only requires aggregate data, the method works for hard-to-measure channels like TV or PR, where there is no one-to-one user relationship to track. It also is a great way of estimating incremental impact without having to run costly incrementality tests, or rely on platform reporting.
What data is useful for Mobile Apps doing MMM?
The technique is called Marketing Mix Modeling because you’re attempting to model the various factors of your marketing mix. Historically, the marketing mix is centered around the 4 Ps: Promotion, Price, Place, Product. Some factors that are commonly important in traditional MMM work aren’t as relevant for all mobile apps; for example, competitor price changes rarely have any significant impact on the app installs, usage or sales of a mobile game, but might be more relevant for an ecommerce app. So what is useful to model?
App Store Ranking
One of key factor essential for Mobile Apps is your App Ranking, which correlates very highly with your app installs. This is great in that it’s relatively straightforward to get access to historic ranking information from a 3rd-party provider like App Annie. However, this is a tricky variable to model because it’s a causal loop: higher ranking drives more installs, but also driving more installs pushes ranking higher. It’s also important to transform app store ranking to account for non-linearity: going from rank 2 to 1 could be worth 10s of thousands of installs per day, whereas going from 11 to 10 will be far less impactful.
PR and Word of Mouth
Another factor which is of significant importance in the mobile app space is PR or press coverage. How much influence this factor has can depend on the industry. For example, this is less marked in the gaming industry, but in the productivity space even a single feature can drive hundreds or thousands of downloads. If you’re doing any cross promotional events, or discounts and sales that can also drive significant engagement, sharing and word of mouth are crucial. The latter is a less obvious driver of installs in the digital space, but I’ve found success including your daily active users (DAU) in your model, because it’s a fairly stable predictor of unattributed installs: the more people use your app, the more chances they have to tell someone about it.
Media Spend
One source of data that’s common between both traditional Consumer Packaged Goods (CPG) / Retail Marketing Mix Modeling and modern MMM for mobile apps is media spend. The channels may be different, as TV is traditionally more important for retail, whereas social channels like Facebook and TikTok are more important for mobile, but daily ad spend is a must for your model. You can get additional accuracy from modeling impressions instead of (or as well as) spend, but I prefer to make the model more interpretable by only including spend. With media spend it’s important to account for Adstock effects (the delayed impact of spend over time) and Saturation (declining efficiency as spend increases) by transforming the data to account for lags and non-linearity.
Seasonality
Finally, it’s important to have a strategy for how to include seasonality. Depending on the industry and region, month of the year seasonality tends to be the most significant, as mobile behavior tends to change significantly towards the holiday season. It can also be useful to factor in the weather, depending on your industry. For example people tend to play mobile games less on sunny days, or are more likely to use a taxi app when it’s raining. Day of week seasonality matters as people typically can’t use their phones as much at work as they do during the weekend. However, be careful how you model seasonality – if you ‘control for’ it you can end up with the answer to the wrong question – the goal is to model how your marketing works during seasonal changes in demand, not despite those changes.
Building an MMM for a Mobile App in Excel / GSheets
Marketing mix models don’t need to be complex, at least not to begin with. In an afternoon you can build a simple MMM that accounts for most of the variations in your data, and can make ~80% correct predictions about the future (depending on your data of course). To show you how to do this for a mobile app, this Vexpower course entitled “iOS14 Broke Our Tracking!” follows a fictional company ‘Bank of Yu’ that must build a marketing mix model in response to loss of tracking from iOS14. You can download the data and final model below to follow along.
To begin with marketing mix modeling, you first must get your data in tabular format. For example, in the datasheet provided there is a simple mix of various important factors mentioned in the previous paragraphs, all labeled with a column name and one single row entry per week. You can use daily or weekly data for mix modeling, but for simple models weekly data is advisable because they tend to have less noise from day of week trends, and can therefore be more stable and robust. For more complex models you need more observations to support more variables (a rule of thumb is 10 observations per variable), so daily data may be needed.
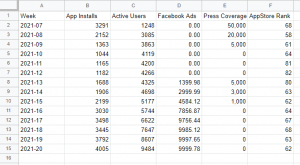
You can see the App Installs, which is what we’re trying to predict or attribute, and the various variables we think predict it. Active Users is included to factor in word of mouth (more users = more chances to share), and Facebook Ads is an important driver of app installs. Also useful to include is the AppStore Rank, and the Press Coverage that our app has received. Because our app store rank is relatively low and doesn’t change much, we probably don’t need to worry about transforming that column to account for non-linear effects, though I would recommend that in a more advanced model. In that case, there are multiple options to try, though a simple power function often suffices (take the data to the power of a number between 0 and 1, found through trial and error based on what most improves model accuracy).
Once you have your data in the right format, creating a model is as simple as using the LINEST function. This takes in the y variable you’re trying to predict (for us, App Installs), and the X variables (Active Users, Facebook Ads, Press Coverage and AppStore Rank) that we wish to use to predict it. Then we select a 1 or TRUE for the next two parameters, to add an intercept and produce verbose output. That leaves us with a series of unexplained numbers and #N/A cells to deal with.
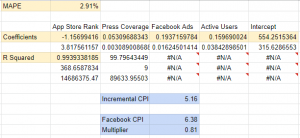
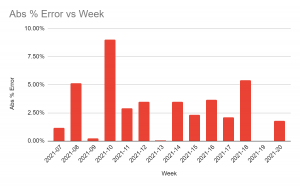
The most important parts of the model are the coefficients in the top row, and the left most cell 3 down, the R Squared value. The R Squared is a measure of how well the model fits the data. Assuming the R Squared is above 0.7 you should be relatively confident in making simple directional predictions, as we’re doing here. Model accuracy can be calculated as the Mean Absolute Percentage Error or MAPE. For this, you take the average of the errors (the difference between what the model predicts and the actual data observed) as an absolute percentage of the actual value. We’ve done this for the sample (i.e. on data our model has seen), but ideally you’d want to hold around 10-20% of your data out (meaning, exclude it from the dataset used to create the model) to calculate out of sample accuracy (on data it hasn’t seen yet). For clues as to what’s wrong, check the errors and see if there are patterns. For example, if a variable is non-linear – like app ranking – you may see the error getting worse as you rank higher. In this case, the above suggestion for transforming app rank data to account for non-linear effects may be helpful.
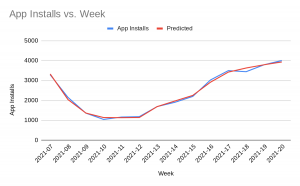
Note that the variables for the coefficients come out in reverse order, with the Intercept at the end (the baseline installs we’d get with no marketing). The coefficients can be interpreted as how many app installs we get per unit of that variable. So for example, if the AppStore rank goes up (i.e. a lower rank), we lose 1.1 installs per week. As well as the accuracy, it’s also important to check that the results are plausible, for example, are any coefficients showing as negative when they should be positive, or vice versa, or have any coefficients become much bigger or smaller than you’d expect from your experience? If you multiply the coefficient for each variable by its input (i.e. the media spend for that week) you get its contribution to installs. Summing up all of the contributions will give you your prediction, which you can visually compare against the actual values to see where the model gets it right, or wrong. This can sometimes give you clues as to important variables you might be missing; for example, a sale period, new channel, or promotional campaign that you were missing from your model.
Assuming we trust the model (and most of the effort goes into getting to that point), we can move on to making recommendations from it. The main goal of this exercise is to determine the true impact of our media spend, so let’s do that now. The coefficient for Facebook ads can be used to calculate the incremental CPI (Cost Per Install) by taking 1/coefficient, so a 0.19 coefficient means a 1/0.19=5.16 CPI. If Facebook was reporting your CPI as $6.38, you now know that they were underreporting likely due to iOS14, and can use a multiplier to adjust your figures. Tomorrow if the Facebook interface says your CPA is $7.00, you can multiply it by 0.81 and be reasonably sure the true CPA for Facebook today is actually closer to $5.67.
What are your options for more advanced MMM?
Once you’ve built your first model in a spreadsheet and have achieved useful results, you’ll want to start improving the model. Making the model more accurate will help you make better decisions, and automating the data collection and modeling process will mean you can make decisions quickly rather than waiting for weeks for a model update. Thankfully the renaissance in MMM has provided many options to improve the process and deliver better accuracy.
Data Pipelines
These days every ad platform, SaaS tool, and cloud database can easily be connected together, making the job of data collection much simpler to automate than it was in the past. It’s best practice to use a tool like Supermetrics or Funnel to pump the data from all available sources into a Google Sheet or BigQuery database, then export that automatically to wherever the model is being built, be that Excel, GSheets, or a custom code implementation. It’s also possible to build your own data pipelines, or use a more technical ETL solution like Singer.
Open Source Libraries
There has been significant investment in open source solutions by the big tech players, who are rooting for MMM as a potential savior to the loss of tracking visibility that came with iOS14. Facebook (Meta) has made the biggest investment in MMM to date, with their Robyn library, which has a number of advanced features. Google has written several papers on marketing mix modeling best practices, and has also released an unofficial open source MMM project. There are also good options for open source libraries that let you build your own tools using linear regression, or even machine learning, like SKLearn. For Bayesian solutions, there are MMM tutorials that show how to use libraries such as Stan.
Automated Tools
There have been a host of startups created in this space in recent years, as companies struggle to build their own solutions (MMM is hard!). Many are simply white labeling open source libraries like Robyn, and building their own data connectors, which we believe is a short-lived approach that will only last until in-house data and engineering teams can catch up. More serious players in the space like Sellforte, Northbeam and of course our own solution Recast use proprietary algorithms which each have their own strengths and weaknesses – it’s a case of reviewing the top solutions against a checklist of best practices and seeing which is best for your business.
Before you go:
- Media Mix Modeling is a part of the Mobile Growth Stack, in light of the end of comprehensive user-level data with iOS14.
- Please make use of our Mobile Growth Stack Slack Stack channel to ask any questions about MMM and we’d love to answer them where we can.
- Check out our deep dive into the solutions offered by mobile measurement partners (MMPs) such as AppsFlyer, Adjust, Branch, Singular, Kochava, and Tenjin. We cover conversion value models, SKAN dashboards, and technical implementation guides for developers and marketers, and finish off with an impact summary across all the major ad networks such as Google, Facebook, Snapchat, TikTok, and Apple Search Ads.
Table of Contents