Now that iOS 15 is here, marketers everywhere will soon be facing the new upcoming features with the same old question: how can I use these to increase conversion? With the new iOS 15 changes, the chance to use ASO to reach and convert more users is bigger than ever, and this is a train everyone wants to board. Once the new product page optimization (PPO) feature rolls out, you’ll need to rethink your strategy in order to use the new capabilities to your advantage, and not just reuse the same strategy you were (or weren’t) using for Google Play.
To recap: the new iOS 15 feature will allow you to test icons, screenshots and app previews, enabling you to find the best variants (aka, new iterations of your assets) for each market, and to gather data about each market’s preferences. This, of course, will be done by testing each one of the app’s assets, raising the questions: how should I test, what metrics exactly should I look at when testing? And how should those be interpreted? In this article, we’ll answer these questions, looking at both the metrics you should track as well as the best practices regarding the actual testing. If you’d like to look more closely at the upcoming iOS 15 changes, feel free to check out the previous article we published around it, on getting your UA/ASO strategy ready.
So, let’s get started.
The Metrics
Let’s say you finished your first testing cycle, and now you have your results. Looking at all the different metrics in the analytics, which ones should you focus on? And why? Well, regarding the metrics we can divide things into two groups: the primary metrics and the thresholds. As the name explains, the primary metrics are the most important ones, the ones that help you measure success (what moves the needle). The thresholds are the numbers you should be striving for in order to get valid results. As for iOS 15 and testing, let’s have a look at these two groups:
Primary metrics:
We have a few big ones we should focus on:
Improvement: According to Apple, developers will be able to see the improvement of the testing variant compared to the control variant. It’s not clear whether Apple will show the changes in conversion rate or the actual downloads, but the improvement is the primary signal for developers to understand how good (or bad) the testing variant is.
Downloads (App Units on iOS): Downloads are the core metric to evaluate the magnitude of a win (or a loss). Any work you do in PPO is to increase the likelihood of users downloading your app once they see it, as well as get more users to download the app.
Conversion rate (CVR) between control and test variants: This is always one of the most important metrics to measure, as it allows us to see which variant is performing better and bringing in higher conversion. That’s also the improvement Apple will likely show developers. When it comes to picking the right variant to go with, this is the main thing to consider, and the holy grail of metrics for any marketer. One note, though: don’t just look at the download-level conversion rate. Once you apply the winner, you should also monitor the installs and in-app events in order to understand whether or not the new creatives bring you the right audience.
Minimum thresholds:
In order to make sure the experiment results are valid, your metrics should reach the following minimum thresholds.
Days running for test: Run for at least a full business cycle (seven days). If you want to collect more data, run it for even longer than that – after all, the App Store allows you to run experiments up to 90 days. It’s important to be aware of anything else that might be going on during this time that can affect your CVR. For example other marketing campaigns, the fact that you are being featured on Apple, or any outside factors (e.g. events, protests, etc). All of these factors may affect the experiment results, which is why a minimum of seven days is recommended. After all, you want a representative sample, not a convenient one.
Impressions: How many users are actually seeing your app? The more the better, of course, but it’s not quite that simple. In order to make sure you’re always using a viable sample, It’s important to have a minimum number of installs per variant – depending on the size of your app. The sample size should be based on your current conversion rate and the expected uplift. There are a lot of sample size calculators online. Use one of those and make sure you only apply a winning variant after reaching the predefined sample size.
Statistical significance: The metrics will be run through a Bayesian model, meaning that Apple might show developers how statistically significant the result is, just like Google does. Google calls out winners when the confidence level reaches 90%. Hopefully, Apple will provide a higher confidence level (95% or 99%) for more accurate results.
Best strategies and practices
Regarding the actual experimenting and testing as well as the results, there are a few things you should keep in mind. The following best practices/strategies can help you find the right way in which to best conduct and organize your experiment period, and also how to interpret the results properly.
Let’s start with best practices regarding testing:
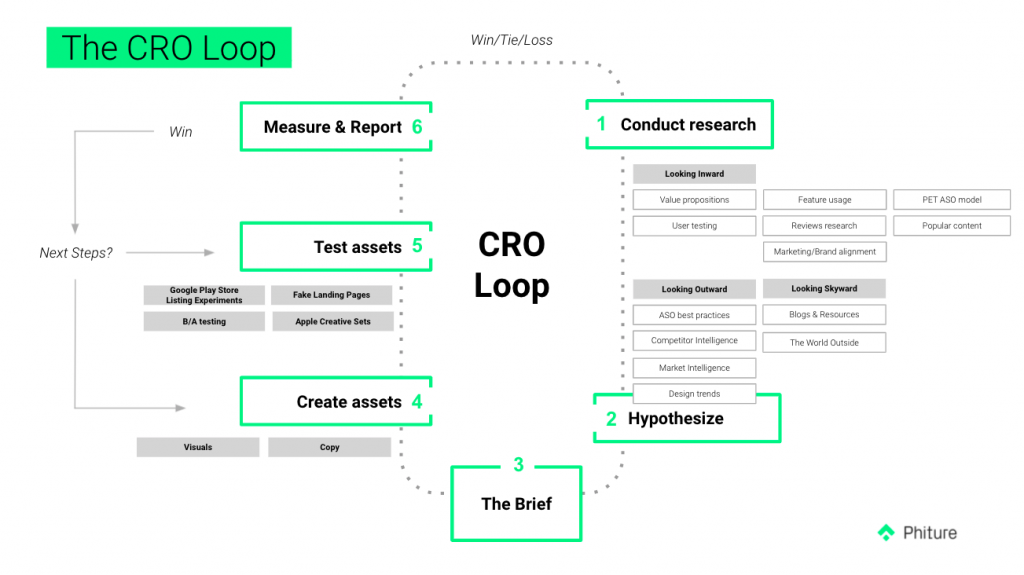
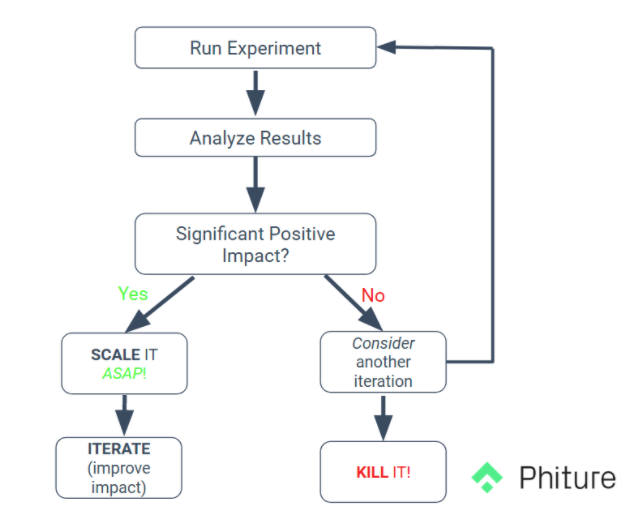
Need to create a testing strategy and a testing cycle? Don’t worry, the CRO Loop is here to help.
Our Conversion Rate Optimization Loop allows you to create the ideal testing strategy for CVR growth, step by step, and with a full cycle. You can have a look at the framework below, and read more about it in our dedicated article. Having a full testing cycle is essential, as it is to keep the following points in mind:
Iterative testing
This is a big one. Make sure not to make multiple, big changes at the same time, so that when one variant wins there’s no doubt as to what made it successful. For example: in a screenshots design test, focus just on changing the font and nothing else. What that means is having a variant A and a variant B with different fonts. Whether variant A or variant B wins, you’ll know the reason why.
Reviews research:
Read through your app reviews (and those of your competitors!) to see what it is that users like most about it (sometimes what we think is the best part of the app isn’t the same thing that users think). Based on this, you can try to see what people are searching for, and then you can highlight these features better.
Localize:
- Keep in mind: There are 7.8 billion people in the world, and only 1.35 billion of them speak English – meaning, never underestimate the power of localization!
- Localizing content has proven to be effective in increasing CVR. The assets you can localize are: copy, in-app images, and creatives. Stick to the best practices from each particular country.
- Once you’ve done your A/B testing and have a clear winner, perform a thorough research on your app’s locales and adapt your screenshots accordingly. The in-app images that work in the US, for example, may be totally uninteresting to the users in the Asia-Pacific (APAC) region. It’s always useful to gather learnings from the locale with the biggest user base and apply those learnings to other locales, but it’s also important not to assume that you will have the same successes all over the world.
Now, let’s look at the results and how to actually measure and report on your experiments:
- Main metrics: App Store: App Units
App units are first time downloads, which, as previously discussed, are essential in finding out how fast (or slowly) your audience is growing. - Regardless of how iOS 15 displays the results/wins/losses (or “improvement”, as Apple calls it), you should focus on the uplift the variant brings. Since Apple’s new update isn’t out yet, we’ll base this on Google Play A/B testing. Here’s what you should focus on:
- How much uplift percentage did the variant bring?
- How many more installs that specific variant will bring you in a year when compared to the control variant? We call this annualized install uplift.
After research, it’s time to hypothesise for new potential experiments – turn each idea into a hypothesis (strategy) – and later, once the experiments have finished running, confirm/disprove the hypothesis and turn it into learning.
Whichever experiments didn’t win, take them as a learning and not as a “waste”. Move on from bad ideas – like we’ve written about before, in an old but still relevant article, kill an idea = stimulus for learning. And if it works, scale it.
Conclusion:
You could A/B test the A/B testing itself, since there are so many different ways of doing it. It’s important to have a strategy in mind, along with best practices, as well as to know what to look for in your results and how to interpret them. By following these best practices, you’ll be able to properly test and, just as important, interpret the testing results with the aim of increasing your CVR. With the new iOS 15 features, it’s never been more important to be on top of your game – and we’re here to help you do just that.
As always, feel free to reach out with any questions.
Table of Contents