


This article explains Apple’s Peer Group Benchmarks. Try using Phiture’s Looker Studio dashboard, to monitor key metrics across various categories and business models, enabling you to optimize your app’s performance over time.
Apple continues to improve analytics on App Store Connect with its new Peer Group Benchmarks feature. Developers can now compare the performance of their apps with their competitors. This brings the App Store into line with the Google Play Store, where this feature has been available for some time. In this article, we outline the importance of this development for mobile growth marketers, and also show you where and how to get started to use them for full strategic effect.
What are App Store Peer Group Benchmarks?
App Store Benchmarks simply compare your app’s performance to that of similar apps on the App Store. Available under App Analytics, and updated weekly, this feature provides insights across the customer journey, enabling you to identify what works well in your app compared to your peers and what can be improved.
Apps are grouped based on their App Store category, business model, and download volume to ensure relevant comparisons.
For privacy reasons, individual competitors are not identified, while all data is not shared with third parties.
How to use App Store Benchmarks?
App Store Benchmarks are a remarkable tool for developers to understand relative areas of weakness and improve their app’s performance. Let’s take a closer look at how to do this.
Step 1: Sign in to App Store Connect
First, log in to your App Store Connect account. If you don’t have an account yet, you will need to create one.
Step 2: Go to App Analytics
After logging in, go to the App Analytics tab in the top menu.
Step 3: See peer benchmarks
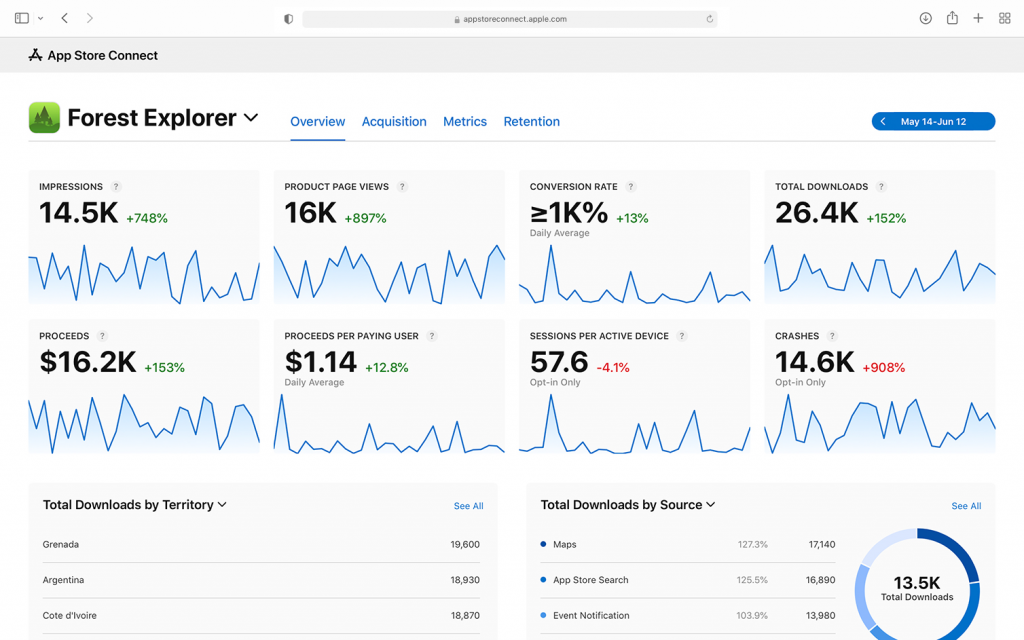
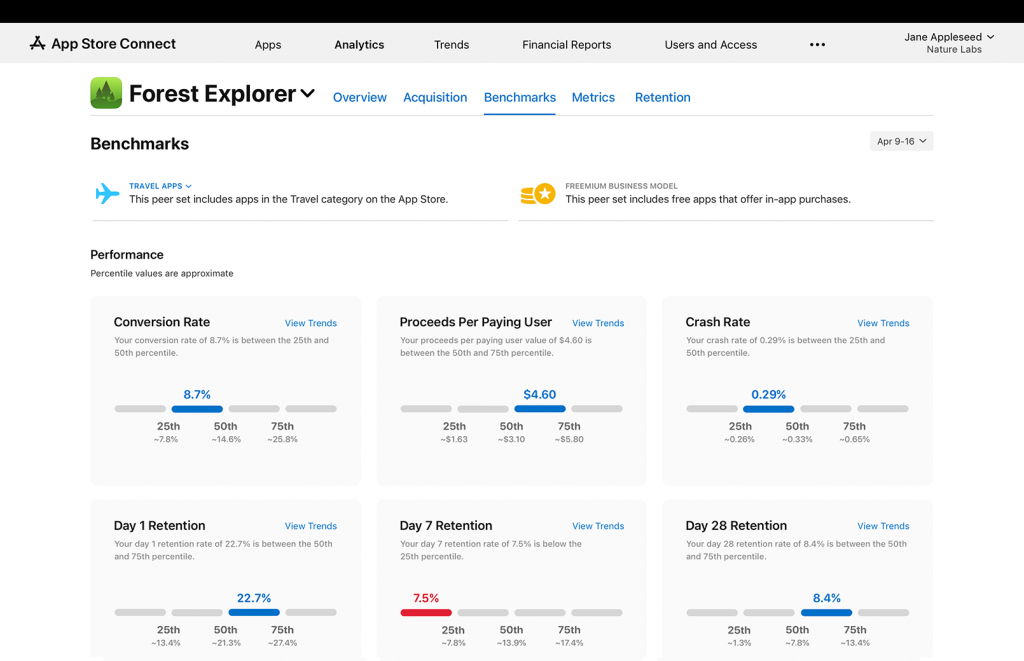
To view your app’s peer group benchmarks, click the Benchmarks tab at the top of the page. Next, you’ll see a dashboard showing how your app compares to other apps in the same category.
Step 4: Customize your benchmarks
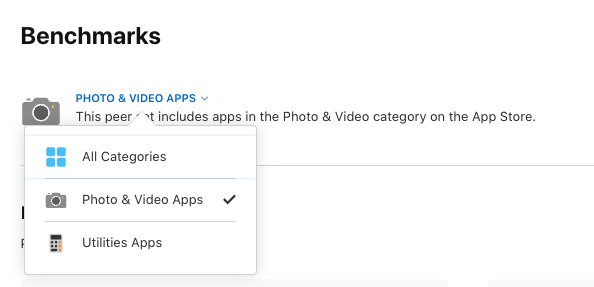
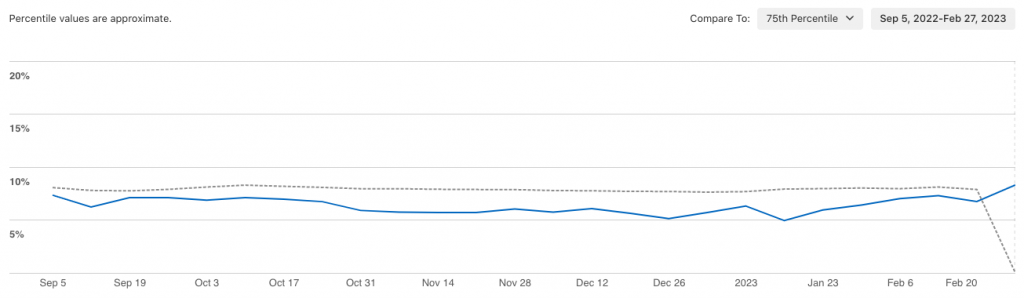
You can apply various filters to your benchmarks, including selecting the category in the upper left corner of the screen. You can specify the date range in the upper right corner of the screen. The data you see in the dashboard changes accordingly.
Step 5: Analyze data
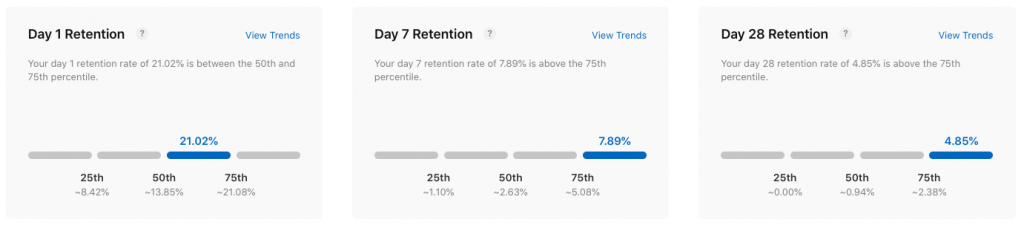
After you’ve applied filters to your peer group, you can start analyzing the data. The dashboard shows how your app compares to others on essential metrics like downloads, revenue, retention, and engagement. You can use this information to identify areas of improvement.
Click on the View Trends button to get more detailed information about the data in the subcategories.
Step 6: Act
Finally, take action using the collected information. If your app is performing poorly in a particular area, find out why and take steps to improve performance. For example, if your app has a low retention rate, consider improving your onboarding process or adding more engaging features.
In summary, peer group benchmarking is a valuable tool to help identify areas where your app is doing well and where it can improve. Customize peer groups and analyze data to compare with other apps in the same category and gain valuable insights. We can use this information to take action to improve our app and get better results.
Apple Benchmarks in ASO
Identify app categories and business models
Choosing the right category for your app and business model is crucial for effectively leveraging the peer group benchmarks feature.
For example, games belong to the Games category, and social networking apps belong to the Social Networking category. Make sure you choose the correct category for your app. It’s important to note that some apps may have different features than others within the same category. Keep in mind that benchmarks reflect general information that might not apply fully to your app. For example, the data relevant to a dating app and the data relevant to Facebook will differ significantly even though they both belong to the Social Networking category.
The app’s business model is also important. Is your app free or paid? Do you have in-app purchases or subscriptions? Knowing your business model helps you identify the right benchmarks.
Analyze app performance metrics
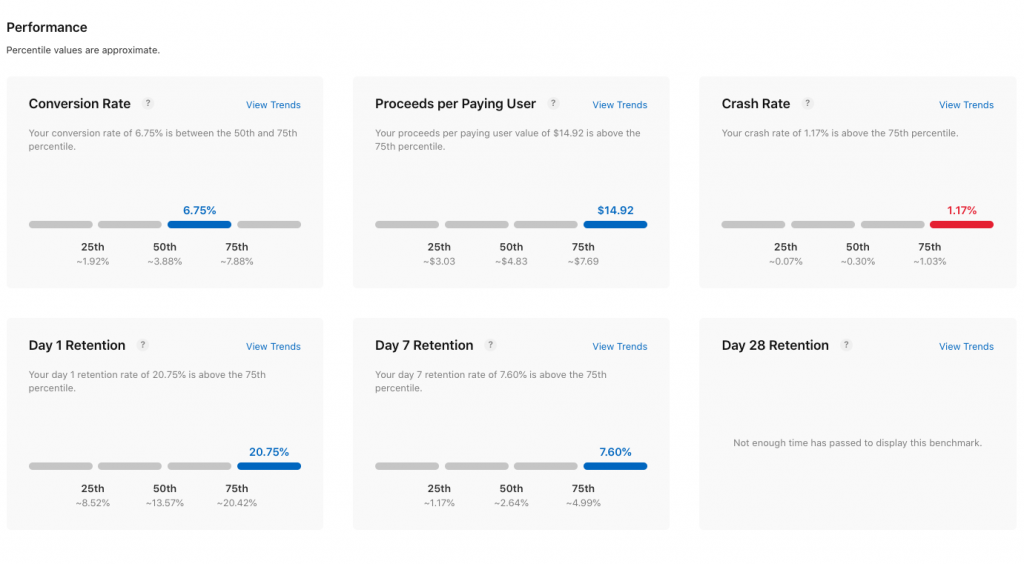
Once you’ve identified your app’s category and business model, you can analyze its performance metrics. Performance metrics show how your app compares to similar apps on the App Store.
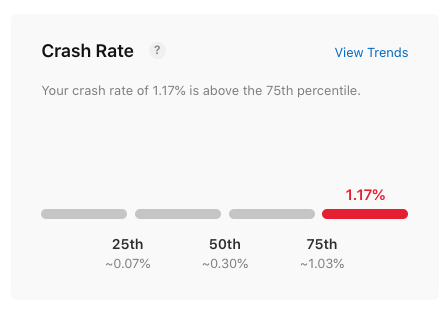
Apple Benchmarks performance metrics include conversion rate, day 1, day 7, and day 28 retention rate, crash rate, and average revenue per paying user. Focus on metrics related to your app’s business model and goals. For example, if you have a free app with in-app purchases, you might want to focus on user engagement and retention metrics.
Identify areas for improvement
After analyzing your app’s performance metrics, you can identify areas for improvement. Look for metrics where your app is performing poorly compared to your benchmarks. These metrics point to likely areas where you need to focus your efforts. For example, if your app’s retention rate is below your category benchmark, you may need to improve your onboarding process or add engaging features to keep users coming back to your app.
Optimize your app’s store listing
Once you’ve identified areas that need improvement, you can start optimizing your app’s store listing. Your store listing is what users see first when they search for your app on the App Store, making a good first impression vital. Make sure you give users the information they need to decide whether or not to download your app.
Monitor app performance
Finally, it’s important to monitor your app’s performance regularly. Use Apple Benchmarks to track your app’s performance metrics over time.
Overview of Peer Group Benchmarks
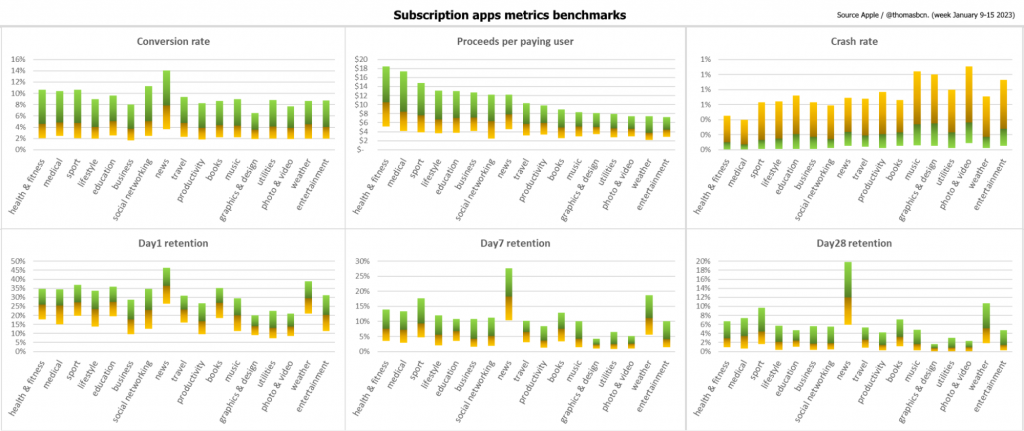
Independent mobile growth consultant Thomas Petit has put all the possible data together in an attempt to present an overview of the new Benchmarks functionality. Thus, you can also learn about categories that you have perhaps not seen the data from and compare your own performance.
Following Thomas Petit’s first attempt, we learned about 12 different categories. With the help of Phiture and ASO Stack, we were able to push these categories up to a further 17.
With three different files prepared by Phiture, you can stay up to date by following information that regularly comes from the ASO Stack community through the Google Sheet files below.
- Subscription: https://docs.google.com/spreadsheets/d/1oZTXn42M92UtC_rHHeK8SSesname0E-NiHq3HexsdrM/edit#gid=1503676733
- Free: https://docs.google.com/spreadsheets/d/19NOyQsEC8DdR4YU1CNpFYGtuMkmXwVLk602fZ8DwtB8/edit#gid=221145495
- In-App Purchases: https://docs.google.com/spreadsheets/d/1HDiNEoJKm99Bpizj7tn6s5bs0ZT59qxlyB0RIDbHwHo/edit#gid=221145495
Before you go
- Phiture’s Looker Studio dashboard, enables you to monitor key metrics across various categories and business models, enabling you to optimize your app’s performance over time.
- In addition to Peer Group Benchmarks, developers can also leverage In-App Events to drive engagement. Use In-App Events to highlight new and timely content updates for your app or game, or showcase them on the App Store to increase your reach. Developers can also review the app’s onboarding experience to ensure it shows the app’s value and how to use it efficiently. Learn more about In-App Events here.
- The ASO Stack Slack is where ASO practitioners from around the world discuss the latest updates to this fast-paced field, including App Store Benchmarking. You can sign up here.
- Need help on how to get the best out of App Store Benchmarks? Reach out to us to see how we can help you.