Understanding overall user satisfaction can highlight opportunities for product improvements and inform ongoing growth strategies.
Alice Muir and Tessa Miskell are Growth Consultants within the Retention team at Phiture and work with numerous clients on all things growth-related. Merlin Penny specializes in data science and leads the Data Science and Engineering team at Phiture.

In this article, we will cover:
How to deploy an NPS (“Net Promoter Score”) in-app modal that can be used to capture user responses and pipe them back into a CRM tool as custom attributes
How to set up a custom dashboard for monitoring NPS scores over time
How to slice-and-dice the data gathered to form data-backed hypotheses about your users
How to leverage survey respondents with follow-up CRM campaigns
Introduction
NPS is a metric, used by many organizations, that calculates overall user satisfaction by asking users to rate the product between a score of zero to ten. From a growth perspective, the final NPS score is a key indicator of whether your organization has a minimum viable product (“MVP”) and, depending on how you execute the survey, which specific areas of the product require iterations.
Deploying this type of survey through a CRM tool such as Braze also gives developers and growth marketers the ability to communicate with users depending on how they scored. For example, sending rewards or referral loops to promoters and sending incentives to retry the product to detractors. An NPS score can also be used to benchmark your organization against competitors.
NPS survey responses are broken into three categories:
Promoters: users who score nine or ten and are not only happy with the product but would also refer a friend or spread the word of mouth
Passives: users who rate the product seven or eight and are satisfied, but wouldn’t necessarily shout about it
Detractors: users who rate the product zero to six and therefore indicate that they are not happy with the product and would likely spread negative word-of-mouth
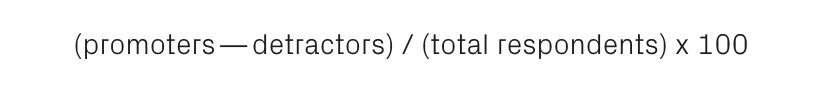
The final score is calculated as:
Execution
There are a number of ways you can collect NPS from users, whether it be through an email survey or an in-app message. In this example, we will focus on execution through in-apps.
In most cases, the NPS in-app survey should contain two screens; the first which asks the user to rate the app, and the second, which allows for open-ended responses as to why the user provided a particular score. Open-ended responses are important for revealing issues with the product which may not be immediately obvious to the product team (e.g. app bugs or poor-quality localization). The second screen can be used to leverage the user in a number of different ways, which will be covered later in the article.
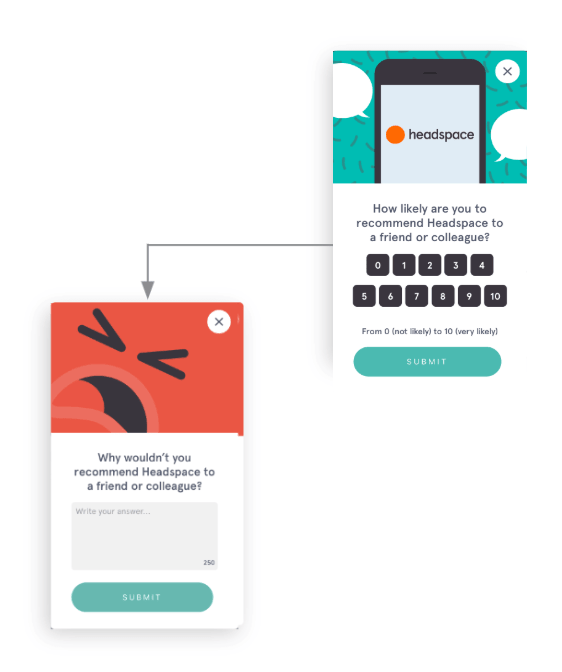
Headspace NPS modal with follow-up detractors survey
The first thing to ensure is that you ask a clear and concise question. You want to keep the question as broad as possible in order to obtain reliable, unbiased results. As pointed-out by SurveyMonkey, the most common NPS question asked is “How likely is it that you would recommend this company (in our case, “app”) to a friend or colleague?”
When deploying the survey through an in-app modal, another thing you should look out for is the design of the scoring mechanism. Individual buttons, ranging from zero to ten, should be used (as opposed to sliders or open text fields). You must also ensure that no score is pre-selected when the in-app modal is opened to avoid users hitting “submit” without consciously providing a score.
Phiture was recently engaged to carry-out an NPS survey for an app that had ≈ 30 million monthly active users. We experimented with a couple of iterations of the in-app modal design and discovered that slider designs for the scoring mechanism provided staggeringly bias results (e.g. more than 80% of users were providing an exact score of 10 without much variation in results of scores between 0–9). Always use individual buttons.
NPS in a CRM Context
In your campaign send settings, be sure to trigger the in-app modal off an event that is likely to catch the user in a ‘neutral’ state of mind, as opposed to a “happy moment” in the user lifecycle. This is particularly important in order to get an unbiased snapshot of your product’s overall NPS score. Events such as session start or app open work well here.
It’s also useful to survey free and paid users separately so as not to inflate the snapshot of overall user satisfaction (e.g. paid users tend to score much higher, on average, than free users).
Finally, be sure to survey active users to avoid targeting users who haven’t yet reached the app’s “a-ha!” moment. For example, the filtering in Braze could be activity_complete > 2 times to ensure that users surveyed had already tried the product’s main features (e.g. in a music streaming app this could be “song played > 3 times” or in a workout app this might be “workout complete > 3 times”).
When you are ready to deploy the survey, ensure that you have coded your in-app modal in such a way that the user responses will be captured, and sent back to your CRM tool as custom attributes. This is crucial for segmenting users based on their provided score and later retargeting them with follow-up campaigns.
Dashboard and reporting
Once you have your NPS in-app campaign up and running, you need to create a dashboard to report the results to relevant stakeholders. This dashboard should provide an easy-to-understand, high-level snapshot of your latest NPS scores and how these scores are changing over time.
Because the NPS in-app saves a user’s app rating as a custom attribute we were able to easily export the data we needed from Braze. To do so we created a series of webhooks that triggered daily for users who entered their NPS score within the past day. The webhooks were split according to the user’s custom attribute “NPS score” (0–10) and their subscription status (Paid or Free). We were then able to easily export this data via Braze’s Export APIs into a daily automated Python script that we wrote to format the data according to our needs and calculate rolling 30-day averages to smooth out potential volatile daily results.

This dashboard gives stakeholders a snapshot of how NPS is looking today (averaged over the last 30 days), how users are split into Paid and Free Promoters, Passives and Detractors, and how the rolling 30-day average NPS is changing over time. Here we can see a gradual but steady decline in NPS scores for Paying users over the period of a month. This provides stakeholders and growth practitioners with areas in which to focus on understanding user sentiment and increase the number of “happy” users.
Gaining a more granular insight into the survey responses provided
Once you have collected enough responses to your NPS survey, a deep-dive into the correlation between user responses and user attributes provides microscopic insight into the problem areas of your app. Key areas for analysis can include, for example, checking the language preference of low scorers to determine if there are localization issues in your app’s copy. Another example would be to look at the correlation between low scorers and platform type to determine how the iOS app performs in comparison to Android, and vice versa. The relevant attributes and segmentation categories should be defined as a first step before any analysis is conducted.
When selecting user attributes, the goal should be to identify the personas of customers that take part in your survey. What device do they use? What is their localization? How many days since they first used the app, and what is their session count? The device type, country, session count, and age (first used the app) are good attributes to select since they are likely to be independent attributes. Other user attributes, such as the platform type, will be less suitable since there is limited action to take with regards to old app versions, other than encouraging users to download the latest version of the app. However, making a distinction for the mobile operating system (iOS or Android) will nevertheless give you valuable insight into the characteristics of the survey respondents.
Here are four attributes to use to start with:
- NPS by country
- NPS by session count
- NPS by user age (first used the app)
- NPS by device
When further segmenting the data for the selected user attributes, we want to make sure that we have sufficient volumes of observations in each category, while at the same time choosing categories that reflect clusters of personas of customers. As a rule of thumb, the minimum number of observations should not be lower than a significant percentage of the app’s monthly active user base, in order to get somewhat meaningful results. If we notice that some groups are below this threshold we group more categories. For example, German-speaking markets can be grouped into DACH (Germany, Austria, and Switzerland).
Here are some suggestions to categorize data depending on the number of observations you have. The idea is to move to a less detailed level if the number of observations is not sufficient.
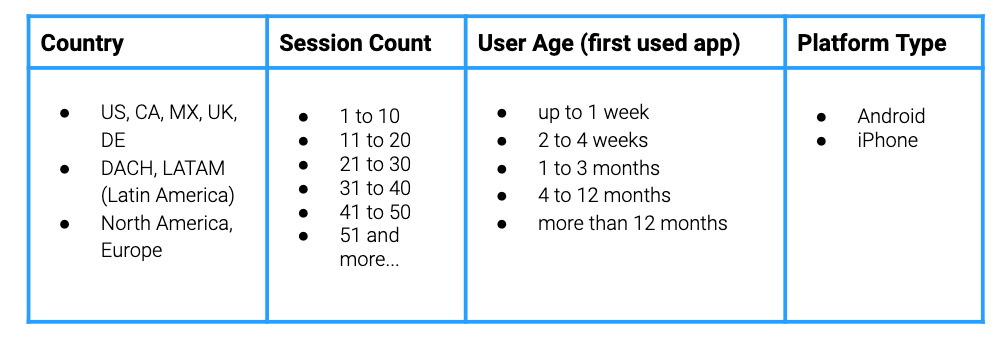
Table with example categories
Once this is done, you can further segment users, for example by Free and Paid users, by adding more conditions to your formulas. In addition to this, you should add the number of respondents and the respondent rate in separate columns. Once these steps have been completed, you should start to notice patterns that tell a more granular story about the provided NPS scores.

Calculating the NPS score for one country ($B5) in Google Sheets
Following Up With Respondents
There are a number of tactics you can use to leverage promoters. One of the most obvious ways is to prompt users, immediately after they score nine or ten, to give the app a rating (or review) on the App Store. Tim Jones, founder and CEO at Launchmatic, has covered this tactic extensively in the ASO stack, and it’s one that our own founders at Phiture deployed at Soundcloud.
This gif originally appeared on Braze.com
Be aware though that the App Store Guidelines explicitly state that “filtered” reviews are not allowed and that developers using this tactic risk expulsion from the App Store. The Google Play Store Guidelines also make reference to this issue by stating; “Developers must not attempt to manipulate the placement of any apps in Google Play. This includes, but is not limited to, inflating product ratings, reviews, or install counts by illegitimate means, such as fraudulent or incentivized installs, reviews and ratings.” It is unclear here whether showing a rating prompt only to users who have already indicated they are happy with the app, would constitute ‘inflating product ratings and reviews’ but it’s worth being mindful of the risks involved.
Referral loops are another way to leverage promoters, particularly if the main goal is user acquisition, as opposed to user retention. Similar to the app rating tactic, one could prompt users directly after they score nine or ten, with an in-app message that says for example; “We’re glad you’re happy with our product, why not invite a friend?” Then you can either deep-link to a messenger or SMS app with a referral link, or provide the user with their own link to manually copy and send to a friend. Remember, the NPS question asks users how likely they are to recommend the product to a friend or colleague, so don’t hesitate to leverage those users who provide a score of 9 or 10. For free users, this could also be the perfect moment to upsell promoters to a subscription or premium account.
For detractors, it is essential to the long-term success of your product that you find out what went wrong. Growth Design recently highlighted meditation app Calm’s approach to user feedback, where they ask users at the end of each meditation session to rate the session with some qualitative options to choose what could be improved. This tactic is perfectly suited as a second screen for detractors, in order to really understand what went wrong during their experience. We would recommend also going one step further by adding a text field for open-ended responses. Later, one can analyze consistency in keywords to highlight trends in negative feedback and opportunities for improvement.
Another tactical example of a follow-up campaign for detractors is to offer them a discount or free trial to retry the product. While it’s a risky strategy, this encourages dormant users to reactivate and give your app another chance. Be mindful of what you are incentivizing the detractor to do, however. You may want to guide them to new content they haven’t yet tried or special bonus features that are only unlocked through a premium subscription. Remember, this is your one chance to change the user’s mind about your product.
Summary
In order to successfully execute an NPS survey through CRM, you must pay attention to the design of your survey to encourage unbiased results. Once you have collected user responses, be sure to take the opportunity to slice-and-dice the data gathered for more granular insights into the minds of users. NPS should be monitored over time in order to be on top of fluctuations that may correlate with app updates or new product features.
Finally, don’t forget to retarget respondents with follow-up campaigns that leverage the value of promoters and gain more insight from detractors.