This is a guest post by Jakub Chour, Mobile Marketer & Marketing Technologist at AppAgent, a mobile marketing agency based in Prague, Czech Republic.

High churn rates are a common problem in the mobile app world. Some users may abandon your app because of bad user experience. Some might simply forget about your app. Sometimes, you just don’t know.
Today, when Cost Per Active User can be tens of dollars, every user that you can retain is valuable. In this blog, I’ve outlined a strategy that can help you to reduce churn using marketing automation platforms like Appboy or Intercom. It’s based on best-practices of AppAgent and my recent successful experiences of reducing the churn rate of taxi aggregator app Liftago.
During this short tutorial you will learn how to:
- Calculate churn rate
- Implement churn detection in your tools
- Determine the value of your users
- Measure the impact of churn reduction strategies
- How to test and improve if your churn strategy works
Why should you work with churning users?
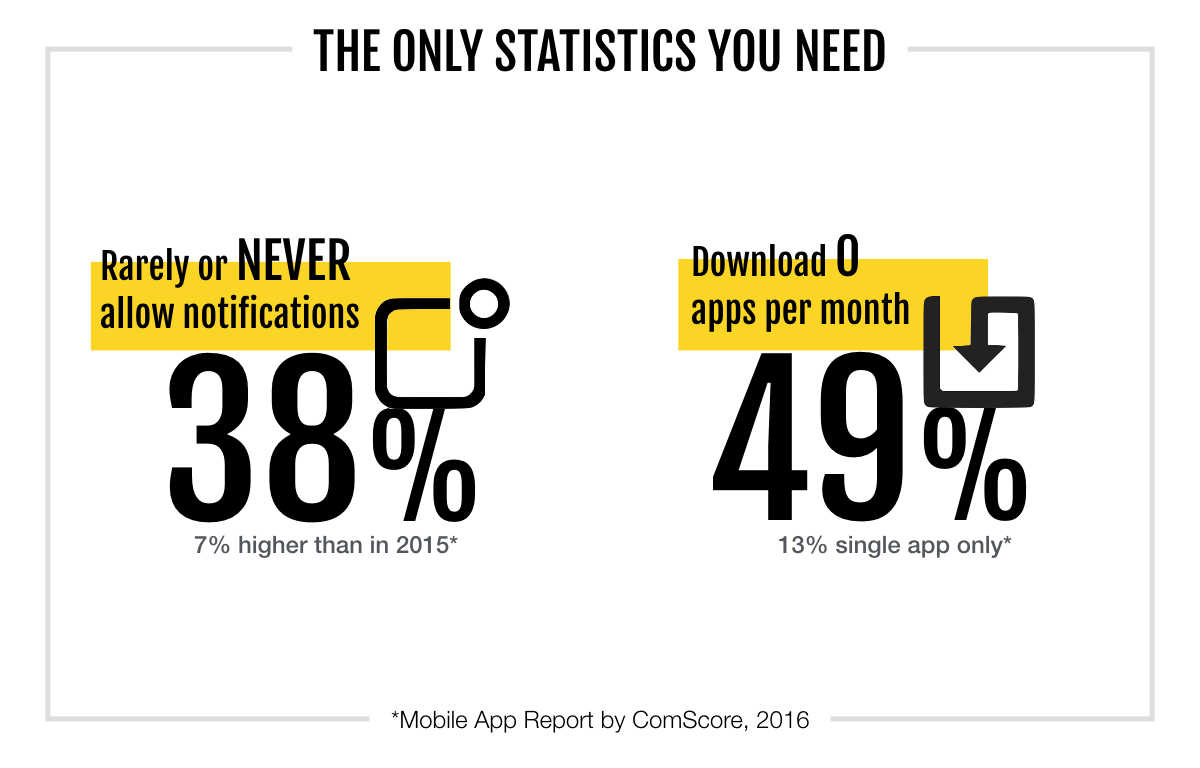
The number of users that allow push notifications declines every year. In 2017, just 38% of users rarely, or never allow push notifications. That’s 7% higher than in 2015.
As a result, up to a third of your user-base won’t receive messages from your most valuable channel, and unless you have mandatory registration, emails won’t work either. With almost 50% of users downloading no new apps per month, and another 13 % downloading just one, you really should focus your efforts on your existing customer base to maximize your potential for growth.
Modeling churn
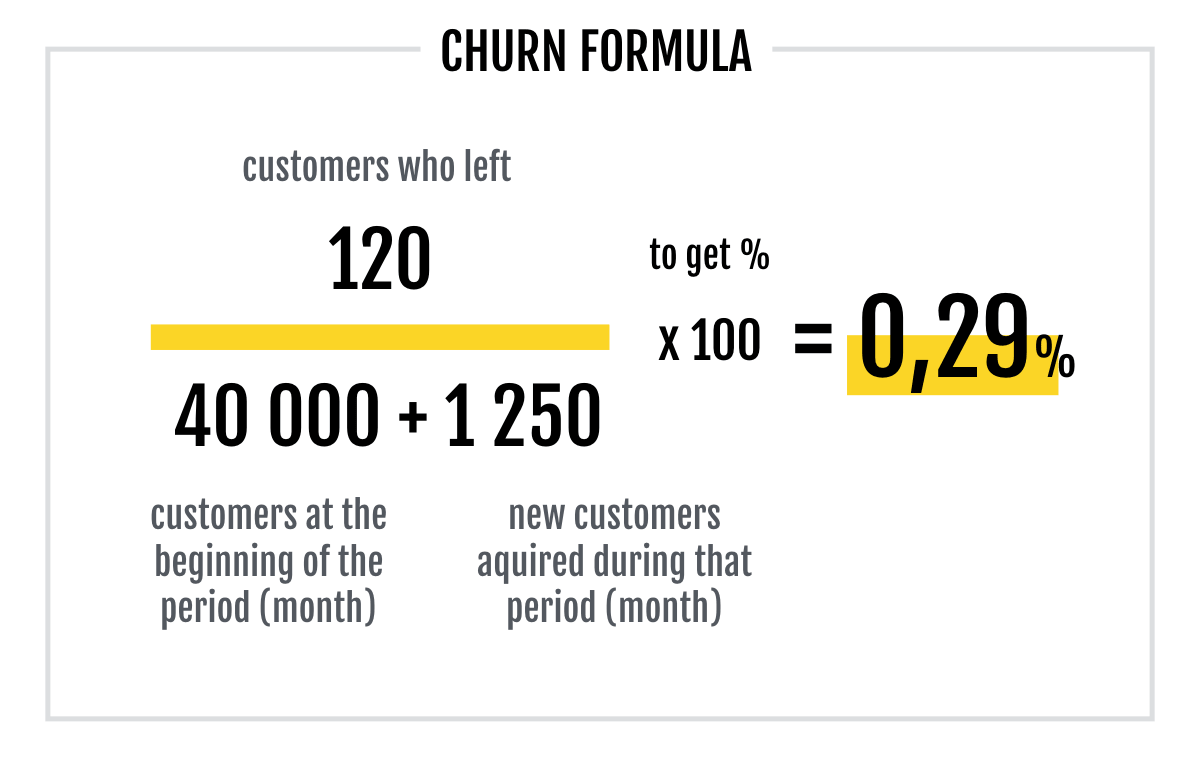
Your churn rate is a calculation of the percentage of people who leave your app during a specific time frame. Here’s a simple way to see it in action. If you take the number of users who joined during July and compare it with users still using the app in August, you’ll be able to use these figures to calculate your churn rate as a percentage.
Each business and market has its own challenges, so it’s impossible for us to say what churn rate is generally good or bad, but using this method over time you can see any progress and improvements that you make.
Mobile analytics tools like Mixpanel present churn metrics “out of the box”, usually based on usage frequency. Unfortunately, you rarely know how this is calculated and you can’t change the settings.
Don’t put faith in numbers unless you know where they come from and how they’re calculated.
To make an informed and reliable calculation of your churn rate, you need to collect data from several sources including:
- app usage data
- payment gate data
- geolocation data
- calculated business data from ETL (like customer segment, passenger rating, etc.)
Business-specific data often needs to be pre-calculated. This is best done through an ETL process (Extraction, Transformation, and Loading process) to generate meaningful values for your analysis.
Using the example of a taxi app, you need to take data from the user’s app and the taxi driver’s app to calculate the pick-up location. The driver should be alerted and the trip should be assigned a “ride-id” (like an order id when someone buys on your e-shop). Data from a payment gate should be added (the payment was successful) and after the ride, a calculation of the rating of both driver and passenger.
Once you have the inputs, your data analyst should create the first version of your model. It’s a complex task and what you initially get is a list of parameters influencing churn and probability for each user, displayed as a percentage. The real value comes when you start processing this data to provide insights.
Understanding churn
In the case of taxi service Liftago, logistics regression results were the following:
The important factors for explaining churn at Liftago were:
- total number of rides for each particular passenger
- % of discount coupons used (the more the passenger used, the more probable churning was)
- avg. revenue from one ride (longer rides = less chance of churning)
- avg. number of rides in given time frames (how frequent is taxi usage in 90 days)
Our initial model came with a 75 % reliability, meaning that it is able to predict churning users with 75 % success rate. Simply put, if the model calculates that 100 users will churn in next 30 days (churn = 1) then 75 of them actually will.
Why isn’t it 100% reliable? For a higher degree of accuracy, more inputs are needed as additional variables make the model more prone to error.
A reasonable goal should be to get to a reliability level of around 85%, but balancing the algorithm is always a trade-off that should be based on strategic business decisions.
Some business owners prefer to take more risks and address a larger audience with less relevant offers. Others choose to sacrifice volume in favor of more precise estimates.
Speaking of tests, this is the most important part of any churn-modeling process. You are not done with a one-time number from your stats guys. You need to test and assess the model to ensure that it is valid and, more importantly if you can do something with those users marked as churning.
Testing and improving your churn model
Testing begins by dividing your users into test and control groups. It’s really important to do this since validation relies on having at least two comparable groups to assess the impact of your interventions.
Your control group won’t ever receive any messages and regular updates are crucial — without refreshing, only the brand-loving users will stay in the group in the long-term and this will skew your results towards campaigns. Why? Imagine you have 100 users in each group, but during the next few months, only 10 heavy users will stay, others are long gone. The power users open every message (so open rate is 10% as only 10 from 100 stayed), but they buy four times more. How do you compare your results if the other group has avg. open rate 20% and conversion rate of only 3%?
If your automation tool doesn’t support automated refresh (like Intercom), I would recommend you to do a refresh at least once a week. Some more advanced tools like AppBoy do this, but each campaign/canvas has its own control group.
You probably don’t want to spend money on users who aren’t valuable to retain. Segmentation analysis tools like RFM can tell you who these users are, but common sense will also work too if you track things like the number of sale coupons used, the total of returned purchases, or simply by comparing your customer avg. order value/revenue with the rest of your customers.
At Liftago this group was made up of customers who always use free vouchers to ride (more than 30% rides were discounted, passenger joined more than a month ago and had more than 4 rides); or those who have churn rate that’s too uncertain (churn probability 0.5 means it’s even less than tossing a coin, cause — remember — we still have only 75% model reliability).
This crucial parameter at Liftago was set to churn > 0.85. It was due to a low number of active passengers if we chose to raise it higher. If it was > 0.95, it would only be a few dozen passengers and in this case, it’s very hard to test statistically.
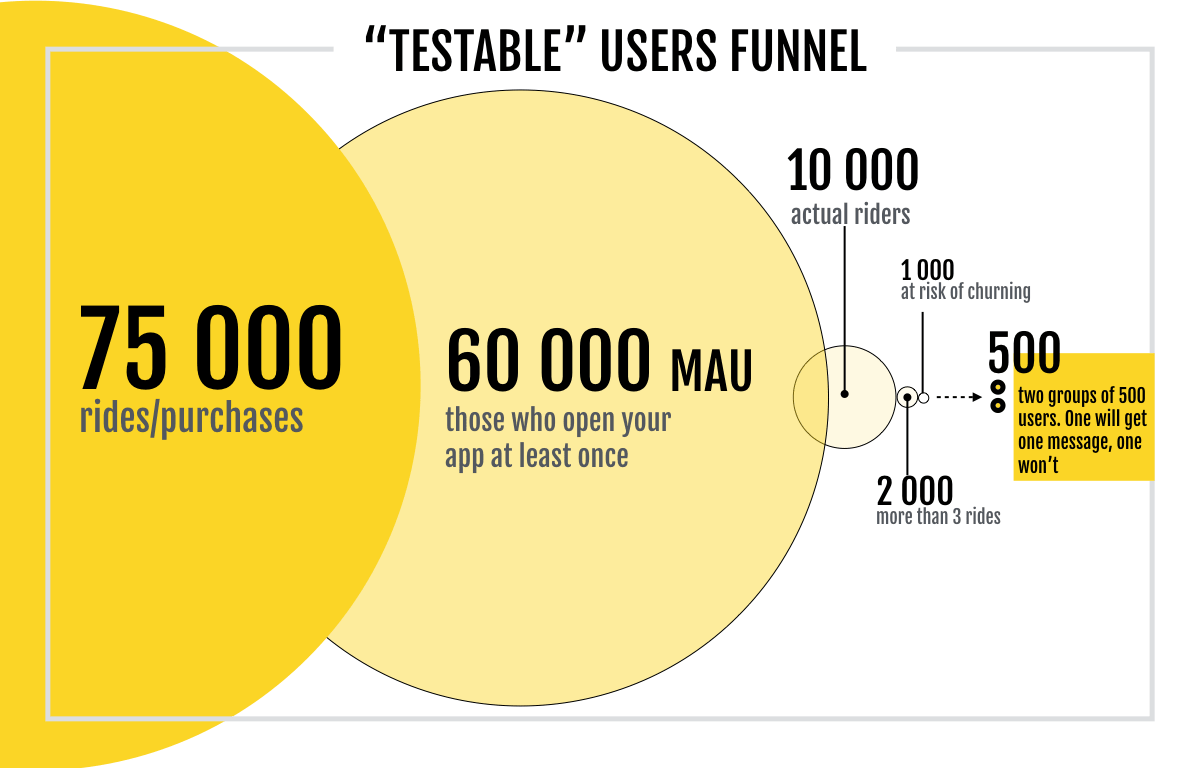
75,000 rides can be taken by 10,000 riders, which means at least 2–3 more MAU is needed to get there. At 60,000 MAU* only some will make more than a certain number of rides in a certain period of time so that the churn rate is actually calculable (4 in a month at least). So, based on your churn parameters with this setting, you end up with 1,000–2,000 users who are at risk of churning. Only these customers can be divided into test and control group, so you end up with 500–1,000 users per group.
1,000 users is a good enough sample size to generate some statistics, but a bit small for extensive A/B testing (I, personally, wouldn’t go under 500 users, after repeated test with 200 user groups when it was difficult to prove anything).
In any case, you have to deal with the fact that every test in this set-up will be slow and will take at least 2–3 weeks. This means such churn reduction model makes sense for apps with at least 60,000–70,000 MAU, but much more would be needed if you want to adjust your churn model on a regular basis.
If you are lucky, you will get your first results within a few weeks. They might look a bit like this:
No push message group has 75% churn rate
The push message group has 71% churn rate
(71% of the users did not take a ride)
=> 4% difference. Wow!
Was the effort worthwhile? If you have tens of thousands of MAU, then no. But the subsequent effort might be. You might get there by relentless testing of the messaging and the bounty. How will churning users react if we send them two push-messages in two days? If we send a voucher that saves them double, then what? What if we send nothing? What if we send kittens?
It’s this part that hurts the most as this effort is long-term and is the least reliable. But, in the same way that we mobile marketers resiliently test ASO creatives, we should also test our marketing automation messaging. Only this way can get as far as Liftago. It works too. Liftago is already saving 17% of its power users from churn.
Happy testing everyone!
Table of Contents