 This is the fifth article in our blog series about the Subscription Stack. Each blog post introduces a key layer of the Stack, and the importance of that layer to your own subscription optimization strategy for your app or game. Here we introduce the key metrics growth marketers need to keep an eye on, in order to successfully optimize subscriptions.
You can read our Introduction to the Stack here.
Part 1: Subscriber Acquisition
Part 2: Conversion Rate Optimization (CRO)
Part 3: Activation, Engagement, and Churn Prevention
Part 4: Tools and Infrastructure
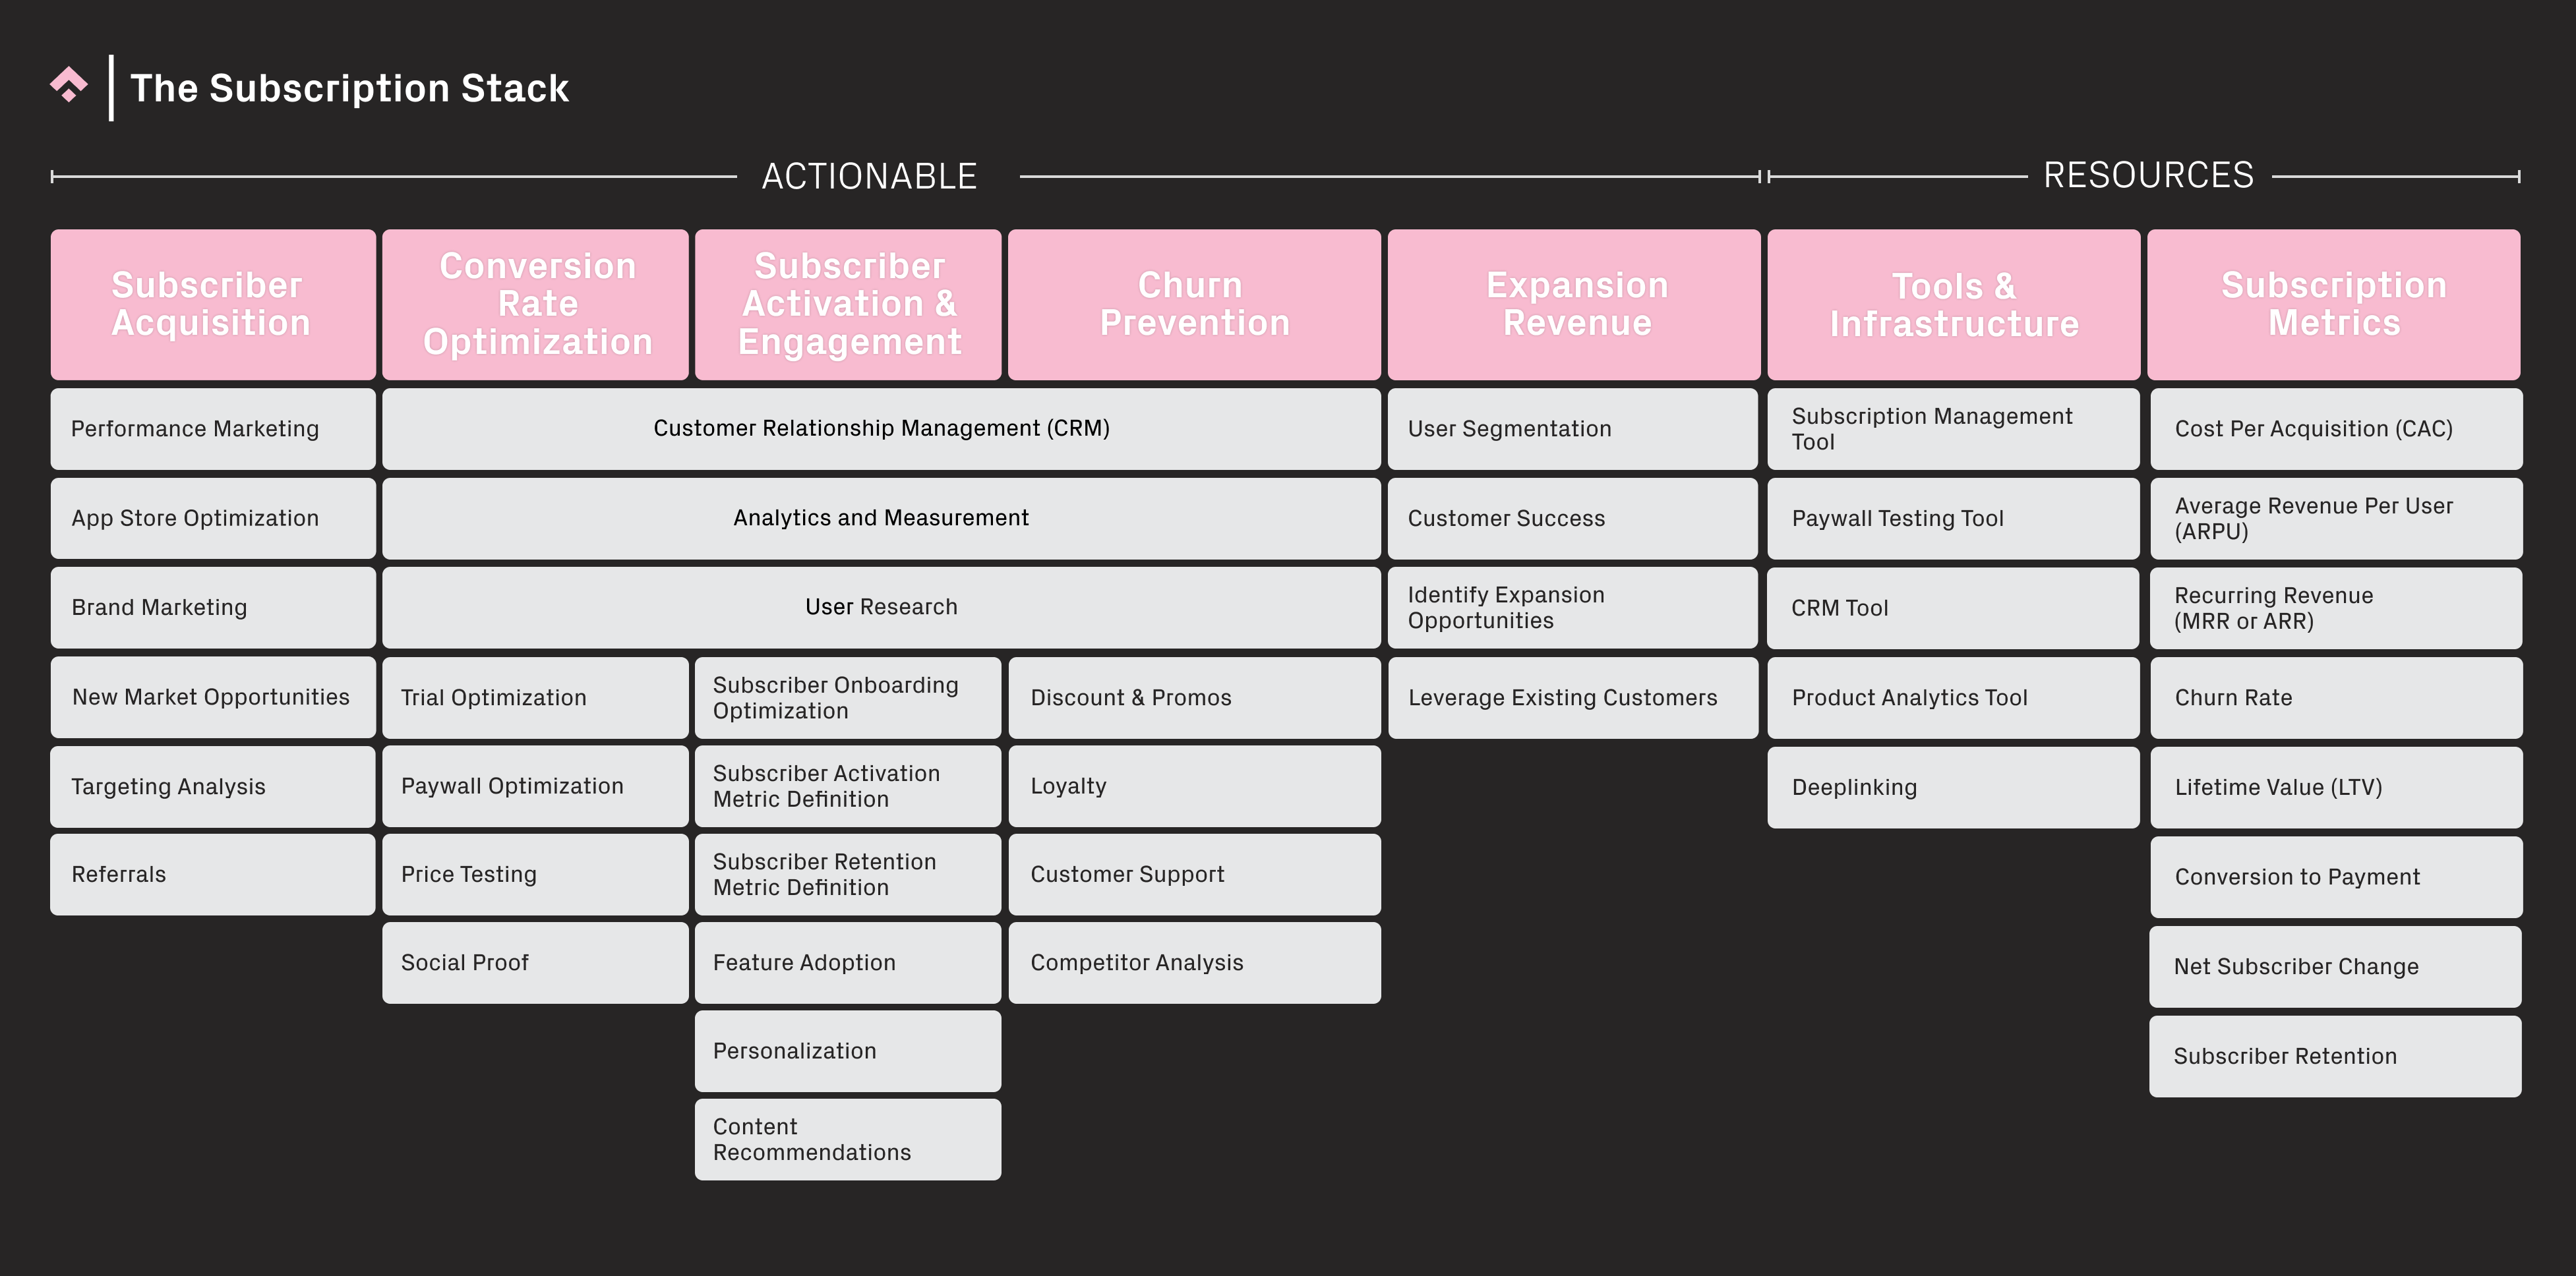
Introduction:
The subscription metrics layer of the Stack is crucial for growth marketers to understand the impact of their initiatives across the rest of the Subscription Stack. A strong grasp of key metrics allows for a better understanding of revenue streams, as well as subscription growth, renewal rates, and churn. By analyzing and understanding these metrics, Product and Marketing Teams can better evaluate the financial viability of their app, track progress towards business goals, and make data-driven decisions for sustained growth in the future.
This is more important than ever, especially in light of macro economic factors. The number of subscription services each competing for a share of a user’s income can become a burden and result in user fatigue, leading to users becoming more selective about the subscriptions they choose to maintain.
Cost of Acquiring a new Customer (CAC)
The Cost of Acquiring a New Customer (CAC) is the total amount of money a business spends on marketing and sales to acquire a new customer. For a subscription-based business, the CAC would include any of the costs associated with acquiring a new subscriber. This could be online ads targeted at acquiring new customers, promotional offers to encourage sign-ups, and the operational costs of managing the sign-up process.
Calculating Customer Acquisition Cost (CAC) for a subscription-led business involves determining the total cost incurred to acquire a new customer.
A general formula to calculate CAC is:
CAC = Total Marketing and Sales Expenses / Number of New Customers Acquired
Determining the CAC is crucial for any subscription led business to analyze profitability as it helps businesses to understand if they are spending too much to acquire a new customer relative to the lifetime value (LTV) of that customer. If the CAC exceeds the LTV, the company is losing money on every new customer, indicating a serious problem with the business model.
Additionally, it helps companies to improve their operational efficiency by highlighting the costly marketing channels and reshuffling its customer acquisition strategies to better allocate their marketing budget. Knowing the CAC can also help businesses predict their growth. If the cost to acquire a new customer is known and stable, the company can forecast how many new customers it can acquire based on its marketing budget.
Therefore, it’s recommended for companies to track this metric over time to understand trends, control costs, and manage their growth effectively.
Average Revenue Per User (ARPU)
Average Revenue Per User (ARPU) is a metric used by companies to measure the revenue generated per user, typically calculated over a specific period such as a month or a year. It’s an early indicator for companies to identify trends and implement timely changes about pricing, product development, and customer acquisition strategies etc. to steer the trajectory of the subscription based business towards profitable growth.
There’s a rather simple formula for calculating ARPU. It is calculated by dividing the total revenue generated in a particular time period by the total number of users.
ARPU is particularly important to understand the business’s financial health and to forecast growth potential on a per-customer level based on how much revenue, on an average, is generated from each user. Additionally, it helps businesses to value their users better and identify business opportunities by tracking ARPU among different customer segments and providing insights into which types of customers are the most valuable. Businesses often fine tune their pricing strategies based on ARPU figures. If ARPU is lower than expected, it might mean that the company needs to adjust its pricing model, offer more premium features, or target a different customer segment.
By tracking and optimizing ARPU, SaaS (Software as a Service) businesses can have a birds-view of the overall health of the subscription based business model to make more informed decisions about pricing, customer acquisition strategies and product development.
Monthly Recurring Revenue (MRR)
Monthly Recurring Revenue (MRR) is a measure of the total predictable and stable revenue from subscription fees that a company can reliably anticipate every month. For businesses running a subscription-based model that relies on consistent subscription revenue is a very important metric.
To calculate Monthly Recurring Revenue (MRR) for a subscription-led business, you need to determine the total revenue generated from your recurring subscriptions within a given month. The easy way to do it is to multiply the number of active subscribers by the monthly subscription price
MRR serves as a vital performance indicator for measuring business performance and tracking growth as an increasing MRR indicates business growth through new customer acquisition or existing customer upselling. Conversely, a decreasing MRR may signal customer churn or other business issues. It also helps the companies to value their customers better as dividing the MRR by the number of customers helps companies to calculate the average revenue per user (ARPU), an important metric that indicates how much each customer is worth to the business.
Given these factors, MRR is not merely just a subscription metric; it’s a reflection of the company’s overall health, effectiveness of its customer retention, and growth strategies.
Lifetime Value (LTV)
Lifetime Value (LTV) shows the total value a new user can be expected to bring over the span of time that they use the app. LTV of a user is determined mainly by three factors that influence the interpretation of their value for the company. These factors are monetization (how much users spend over their lifetime in the app), retention (how often they engage with the app), and virality (how many new users will the existing subscribers bring in by referring to the app).
LTV is calculated by multiplying ARPU (Average Revenue per User) by the average number of months/years that a user is using the app.
LTV is the ultimate indicator of success for SaaS businesses as it helps to determine the overall potential value of the users and in turn, measure business health. It can further be used to calculate the return on investment of your marketing efforts: by comparing LTV with the cost of customer acquisition (CAC), businesses can determine if they are profitable on a per-user basis. If the LTV is higher than the CAC, the company is making a profit from its customers. Similarly, it also provides insights into customer retention and churn. If the LTV is decreasing over time, it could be a sign that customers are churning too quickly, which might lead to efforts to improve customer retention.
By focusing on increasing LTV (for instance, by improving product quality, customer loyalty program, user experience), SaaS businesses can increase their profitability and sustainability over the long term.
Revenue churn / churn rate
Churn rate is the percentage of subscribers who discontinue their subscription within a given time period. In simpler terms, it’s a business metric that calculates the percentage of users who leave a product over a given period of time, divided by the remaining number of users.
SaaS churn can take several forms, to name a few: user churn, subscription churn, and revenue churn. Depending on the company’s business goals, it is important to measure churn as an early indicator to highlight potential problems with the product, service or customer satisfaction, which could negatively impact long term, sustainable growth.
To calculate churn rate for a subscription-led business, you need to determine the percentage of subscribers who have canceled or stopped their subscriptions within a specific time period
Churn Rate = (Number of Subscribers Lost during the Period / Number of Subscribers at the Beginning of the Period) * 100
Monitoring the churn rate over time helps businesses understand customer retention, assess the effectiveness of their subscription offering, and identify areas that may need improvement, such as customer support, feature enhancements, or pricing strategies. By reducing churn, businesses can increase customer lifetime value (CLTV) and improve the overall health and growth of their subscription business.
Customer retention rate / subscriber retention
Calculating retention rate is essential for a subscription based model given the monetization model is connected with a recurring billing structure. The Subscriber retention rate is the flip side of churn rate: while churn rate focuses on the subscribers who leave, retention rate focuses on the subscribers who stay.
In a subscription-based business model, the retention rate is calculated by taking the number of subscribers at the end of a period (minus any new subscribers gained during that period), dividing by the number of subscribers at the start of the period, and then multiplying the result by 100 to get a percentage. To calculate subscriber retention, you should:
- Find out how many existing subscribers are there at the beginning of the period. (S)
- Find out how many of these subscribers still exist at the end of the period. (E)
- Determine the total number of new subscribers retained this time period. (N).
Here’s what you can find in the calculation : [(E-N)/S] x 100 = SRR|(subscriber retention rate.)
Businesses operating with a subscription model rely on a healthy subscriber retention rate, as high retention rates usually indicate lower costs related to customer acquisition and therefore, indicate higher profitability. A high retention rate also ensures a predictable and steady revenue stream and is essential for effective planning for long term growth. A higher retention rate often also indicates high customer satisfaction and loyalty. Loyal users typically have a higher lifetime value (LTV) and can be highlighted as brand ambassadors, thus becoming advocates for your business, leading to organic referrals and more customers.
Further strategies to improve retention can include improving customer service, creating loyalty programs, and ensuring the product or service continues to meet and exceed customer needs.
Trial conversion rate / conversion to payment
The trial conversion rate is a key metric that helps to determine if your users value your product enough that they would be willing to pay for it. It is a metric that’s used by subscription-based businesses to measure the percentage of users who convert from a free trial of a product or service to a paid subscription.
A very high conversion rate indicates that the value of your product is realized by the users and are willing to trust you with their investment. Conversely, a low conversion rate means that your users are finding it difficult to understand your product or don’t value your product enough to be willing to pay for it. Businesses using trial conversion rate to make decisions regarding the product and pricing are able to optimize efficiency and generate high impact results.
The formula to calculate the trial conversion rate is straightforward:
(Number of users who become paying customers / Number of users who signed up for a free trial) * 100 = Trial Conversion Rate (%)
This metric is particularly important in measuring the effectiveness of the quality of leads acquired with the marketing efforts, a higher trial conversion rate can mean that this strategy is working well. Additionally, the metric is a blessing for the product team given a high trial conversion rate can also suggest that users see value in the product or service, as they’re willing to pay for it after trying it for free. Knowing your trial conversion rate can help with forecasting and planning, such as predicting future revenue or determining how many new customers you might gain from offering a free trial.
In essence, tracking and improving the trial conversion rate can help subscription-based businesses boost their revenue, refine their customer acquisition strategies, and better understand the perceived value of their product or service.
Conclusion
You should now have a solid understanding of the importance of these key metrics to your subscription optimization efforts. A firm grasp of these metrics will only serve to focus your efforts across the rest of the Subscription Stack, and ultimately boost your chances of success.
Before you go
- If you’re interested in one of the tools that can help you measure these metrics mentioned above, make sure to let them know you found them via Phiture, and you might qualify for a free trial or a discount!
- To find out more about how we can help your mobile subscription app build the ideal tool stack to measure these metrics, reach out to us here.
- For more information on subscription management and paywall tools, see our handy documentation here.