The key to scaling performance campaigns is discovering a creative hit. For creative teams this can be a time consuming process, not to mention a drain on creative resources to constantly iterate new ideas. In our experience, aligning on a systematic approach to turn creative ideas into results is crucial.
The systematic approach you decide upon needs to be a cross-team commitment right from the start. Firstly, the performance marketing, creative and analytics teams need to agree on a standardized creative naming convention for all channels. This is because all of our insights will come down to parsing automated reports based on the ad name.
For example, some attributes you may consider including are:
- Asset type: static, video, gif, HTML5
- Graphic design style: 2D, 3D, lifestyle, animation
- Theme: seasonal, app product feature 1, etc.
- Message: for videos, consider capturing what’s in the first 3 seconds
Together the entire team should determine the most important attributes to track and then set up a shared file for consistency. We recommend a shared Google Sheet. See the example below:

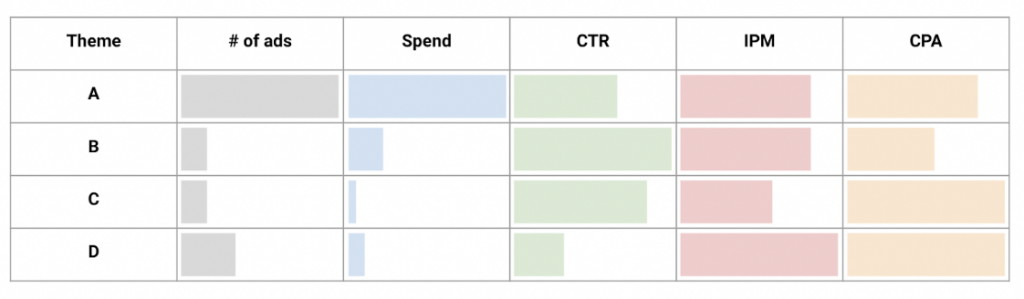
Each column concatenates into one ad name. This is then separated by an underscore making it possible for the analytics team to parse reports through each column, aggregating across all the ads you test over time. This creates the ability to run bulk analyses to identify recurring elements in the creative performance by channel. For example, if you needed to analyze theme, you would build a report which would look something like this:
We recommend connecting to a reporting tool such as Data Studio (typically the easiest to create tables for analysts), Tableau, Periscope, etc. You can of course also do this in Excel or a Google Sheet, but it’s preferable to automate this process with API connections (assuming you have data resources available to support this).
How to structure the report
The report should have tables that break down each of the columns being tracked. This should include the ad name with key metrics your team needs to measure. As the reports can get very detailed and metric heavy, we suggest creating two views based on the stakeholder viewing the report:
- A granular report for campaign managers with all the necessary metrics needed to study and understand the performance of a creative.
- A high level, easy to digest report for the creative team with no more than two metrics to give a snapshot of what is and isn’t working. We suggest only having filters by market, channel and device with fixed views for:
- All time top performers: Filtered by highest impressions or spend, that is within target KPI
- Last 30 days top performers: Filtered by highest impressions or spend, that is within target KPI
- Worst time top performers: Filtered by lowest impressions or spend, that is not within target KPI
- Last 30 days top performers: Filtered by lowest impressions or spend, that is not within target KPI
Tip: Don’t forget to apply this process to your text copy too. It’s valuable to have similar reports for the performance of your text assets as you’ll also gain insights on messaging for future copy.
It’s important the performance marketing team teaches the entire team how the ad networks creative testing process works, how this varies by channel, and the definition of all the metrics and targets. It may also help to organize a few performance marketing shadowing sessions for everyone to get a better understanding of ad network and auction dynamics.
Looking inwards
At least once a month it’s imperative the teams meet to discuss historical creative results and learnings, and incorporate this into the next round of production.
Useful steps to follow in these sessions might include:
- Analytics team prepares a report with the data by device, channel, and market, then adds initial insights from an analytics perspective.
- The performance marketing team confirms the data is accurate, then adds their own ad network expertise, context and learnings.
- The report is then shared with the creative team for final insights.
- The team lead organizes a workshop to discuss learnings and ideas for the next round of production.
- If possible, involve the product/CRM team to ensure product roadmap visibility and ideally, to also provide additional insights into the user journey.
- Create hypotheses for every test and track results and learnings accordingly
Tip: Don’t forget to include copywriters into this process. It’s key to have them involved in the performance of your text assets as you’ll also gain learnings on messaging for future copy.
Before you go
At Phiture, we automate this entire process for you. Reach out today to learn more about how we can help you better understand creative performance.