This is a guest post by Peter Fodor, founder at AppAgent, a mobile marketing agency based in Prague, Czech Republic.
A recent survey on download decisions claimed that the description of the app was the second most important reason for install, with rating coming in as number one. The problem is, what people say and what they actually do are often two very different things, so I set out to find the truth about the reasons why users download the apps that they do — and discover why some apps stay ignored.
My research involved reviewing the data from five applications from the AppAgent portfolio. We analyzed these statistics using three different A/B testing tools, with a sample of over 25,000 visitors that generated a total of 10,000 installs.
Spoiler: people don’t read the description!
Note: More about the methodology at the end of the post.
Executive summary:
- Users spend an average of just 7 seconds on the store listing page.
- Just 13% of users scroll through screenshots. Games show better engagement.
- Only 3% of users enlarge screenshots, and nobody bothers to scroll through full-screen visuals.
- People don’t expand the app description. Above-the-fold plays an essential role in the conversion rate.
- On average, only 2% of users play video on the store listing.
Life or death in 7 seconds
We discovered that the average time people spend on a store listing is 7 seconds. The fact is, the vast majority of people leave the page even sooner. Engaged users hang around for a little longer, but they all follow the same process: check the icon, view the first two screenshots, and scan the first line of the app description.
The data confirms our observations from user testing. When visitors interact with a client’s app in the store it’s a blitz scan of major visual assets with no interaction at all before either installing the app or leaving the page for good.
It’s 7 seconds or nothing.
Tell your story in first 2 screenshots
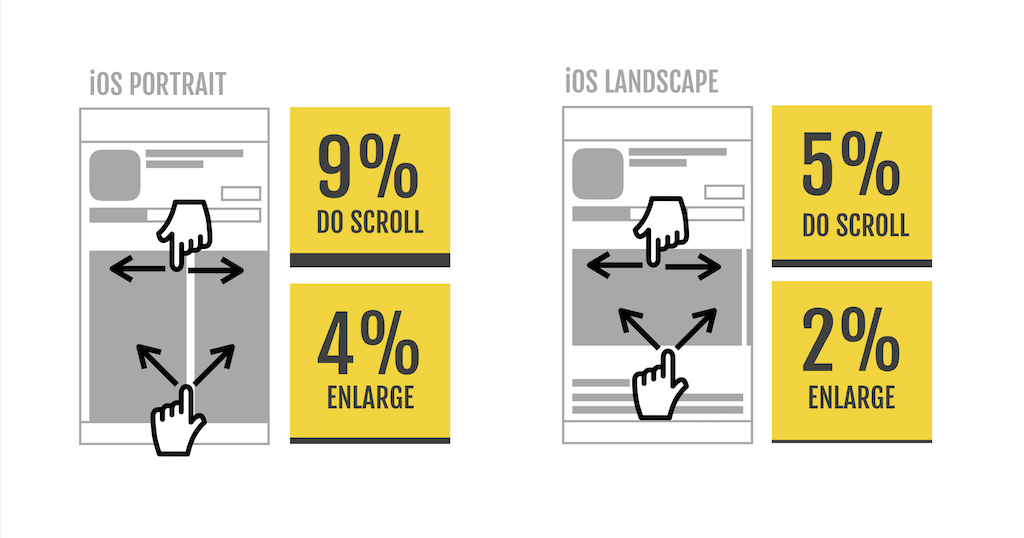
As a mobile marketer, you probably try to use as many screenshots as you can to tell your story. The more content, the better, right? Wrong. We found that only 9% of people scroll portrait screenshots of apps. Gamers were more likely to engage, but it’s not a massive increase with just 17% of them swiping through screenshots. Our experiment with landscape screenshots revealed the scroll rate drops down to 5%!
The findings of our research make it clear that you HAVE to explain the core benefit of your app in first two (iOS10, Google Play), or three (iOS11) screenshots if you are using portrait images. If you really want to use a landscape image, you’ve got just one shot.
Understanding this can help you prioritize your images. Make your major play in the first two or three screenshots, and don’t invest much into remaining screenshots. Whatever you do, don’t attempt to communicate your major benefit on the last screenshot.
Another critical aspect where most developers fail is in the “readability” of screenshots. We consistently observed that fewer than 4% of users looking for an app enlarge portrait screenshots, and only 2% enlarged landscape screenshots. For gamers, it’s even less at just 0.5%. This is probably because the gameplay is usually clear enough even from thumbnails.
The main lessons for your designers should be to ensure that app screens and one-liners are big enough that users can read them, without needing to enlarge the image. At AppAgent, we enlarge key elements of the UI such as detail of the price calendar in case of Kiwi.com and to keep one-liners at a maximum length of just 4 words.
Don’t expect people to read
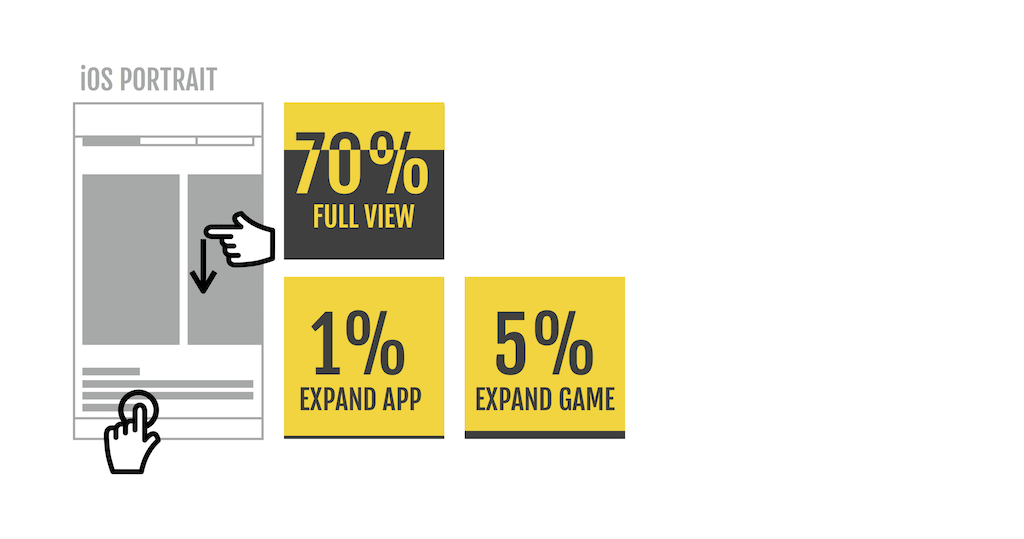
About 70% of users scroll down the store page to the point where they see full screenshots. Even fewer than that scroll deeper to the above-the-fold description.
Looking back at the survey results where 52% people claim the description plays a major role, our data consistently show that less than 1% of users expands the app description.
Gamers are again more engaged, with 5% tapping on “Read More.” This makes sense when you consider the time it takes to download 500 Mb game when compared to the average 20 Mb app.
If we consider this finding alongside the 7 seconds visitors spend on the store listing page, it becomes clear that people scan only the opening part of the description to get the main point. In this context, lengthy descriptions packed full of keywords only make sense from an optimization perspective. In practical terms, knowing that people don’t bother to expand the description means you shouldn’t worry about prioritizing keywords over artistic copywriting.
Video plays a surprisingly minor role
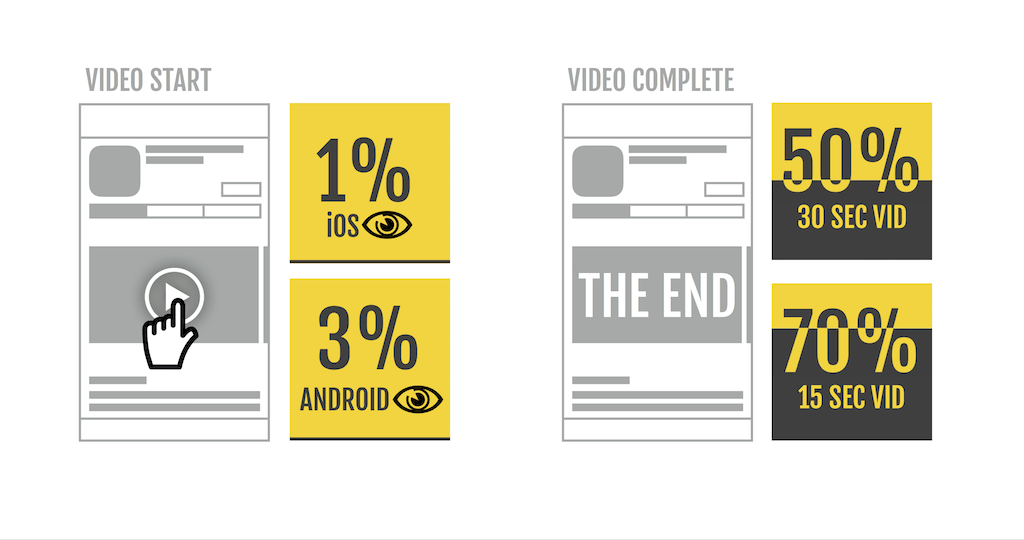
Personally, a fascinating insight for me was the extremely low rate of video views. When we combined the data from 3rd party A/B testing platforms, we found that only 0.5% of iOS users watched any video content. The sample was nearly 9,000 visitors so a statistical error should be minimized. We assumed that such a low-rate must be the result of technical issues, or potentially the low bandwidth of the fake store listing page. When we reviewed the Android platform and YouTube results however, Google Play confirmed that the rate of video views genuinely is that low — with between 2 to 4% of visitors viewing video. The best single performer was a game by About Fun which reached 5.9% on Google Play. Impressive in context, but still in single digits. These findings come from an analysis of 4 different apps, 3 million store listing visits and 70,000 video views.
The best video view rate we’ve seen reached ONLY 5.9% on Google Play! Other apps were between 2–4%.
Video completion rate is usually between 50% (30sec spots) to 70% (15sec spots). The drop-off rate differs a lot from 30% after 10 seconds for Kiwi.com and Ocean Blast, to 15% for Tiny Miners and BudgetBakers.
Sebastian Knopp, marketing advisor to flaregames from Karlsruhe in Germany, posted a great insight on Mobile Dev Memo Slack that serves as a logical explanation:
I have a similar experience [with a low view rate]. In my observation, the video usually does not improve the performance in a significant way — at least for the games I’ve worked on. We even discussed this with 10 focus groups with each of 5 participants and across all demographics, iOS users only. A quite common answer was — “I simply download the app and have a look, it does not take much longer than loading the video.”
Sebastian’s insight summarizes our findings succinctly. People simply install the app and give it a try because it’s often just as quick as exploring the store listing.
iOS11 throws a bomb on ASO
The market is gearing up for iOS11, and we know that there will be big changes. With 3 screenshots appearing in search results, the number of installs directly from the search page will increase. We predict that visitors will rarely visit the store listing in detail.
With iOS11, the number of installs directly from the search page will increase and visitors will rarely visit the store listing in detail.
The new challenge will be to leverage the video auto-play and concentrating on how to promote your app using the three small thumbnails that appear in search results. This could be a tricky goal, especially in the light of recent weeks where Apple has tried to reduce the amount of post-production and manipulation of videos and screens.
There are interesting challenges ahead for mobile marketers. The marketplace continues to change, and so do our customers. As always in marketing, the key is to understand your customers and their behavior.
Thanks for reading and feel free to share this post with fellow marketers and ASO specialists.
Appendix: Methodology
In the past year, we’ve conducted seven iOS store listing experiments using all three major A/B testing platforms Splitmetrics, TestNest and Storemaven. Part of the test were two apps (Tradewise, Kiwi.com) and one game (Blades of Fate). Each app had at least two tests with a minimal duration of 4 weeks. Experiments had between 1,130 to 9,000 visitors acquired from Facebook ads using the best performing target group from previous mobile app install campaigns or in two cases using the smart banner on the client’s mobile web. The paid traffic came from US, Israel, Philippines, Czech Republic; the traffic from smart banners was naturally global but mostly coming from US, UK, Czech, Germany, Spain, and France. Next to A/B tests, we’ve also looked at YouTube data for analyzing the video on Google Play for three more apps and games (Wallet, Ocean Blast, Tiny Miners), where we’ve analyzed 174,000 video views.


