As an ASO consultant, it’s extremely important to stay on top of the technical changes and updates in the new releases by Apple, in order to keep improving your app’s conversion rate. Analyzing data through understanding the right metrics plays a crucial role in conversion strategy.
Following the new iOS 15 update, this article will explore which metrics to monitor on the App Store to boost your conversion strategy and remain ahead of your competitors.
Key metrics
It’s important to first tell the difference between vanity metrics and actionable metrics that ensure informed business decisions. To understand it completely, we would need to dig deeper into Apple’s metric terminologies.
Apple separates your app’s metrics into three categories:
- App Store (how many times users have viewed your app and if they viewed it more than once)
- Sales (pre-orders, first-time app downloads and purchases, and in-app purchases)
- Usage (installations, sessions, crashes, and active devices)
Here’s a more in-depth tutorial from Apple on how to view your metrics and what they all mean.
Historically, impressions (unique devices) and App Units were used to calculate conversion rates of the apps. With the new iOS 15 update, App Units are now categorized into “First time Downloads” and “Redownloads.” This allows ASO consultants to understand conversion more accurately by separating returning from new users, who, as their familiarity with the product varies, convert differently.
By taking into account first-time downloads and impressions for unique devices only, we can gain insights into the conversion of new users. This is an important metric for understanding the impact of organic ASO work. If your app has a larger share of redownloads, it might be better to analyze this as a priority as well but ultimately, the groundwork will remain the same.
Another metric to pay attention to is selecting the correct traffic sources. There are five different source types, which show you in a more granular way where the impressions/downloads are coming from:
App Store Search: Customers viewed your app or downloaded it for the first time from searching on the App Store (includes Search Ads in App Store search).
App Store Browse: Customers viewed your app or tapped to download it for the first time while browsing the App Store (for example, in the Featured, Categories, or Top Charts sections).
Web Referrer: Customers tapped a link from a website that brought them to your App Store product page.
App Referrer: Customers tapped a link in an app that brought them to your App Store product page.
Institutional Purchase: A company or a school bought your app for their employees in bulk.
In your analysis, the traffic from App Store search is the most relevant, since users find your app via searching branded or generic keywords. Conversion rate could be calculated with the following formula:
Conversion Rate = Impressions (unique devices) / First-time downloads
Running the experiments and analyzing metrics
There are various ways of testing different iterations in metadata (visibility) or creatives, which could be leveraged to better analyze your changes and understand the impact. The following options could be used:
- Sequential experiments
Sequential experiments can be conducted by including the iteration in the build to be released as a regular update for your app.
Follow these steps to analyze different metrics:
- Go to the metrics tab of your App Store Connect.
- Sort by traffic sources to analyze search traffic.
- Filter by first-time downloads (redownloads if necessary) and compare with impressions (unique devices).
- Filter by country of interest.
- Set the date range, ideally two weeks before and after the date of update.
- Export data to get the CSV file.
Now with data in hand, you can find the average conversion rate of two weeks before and after the update by using the formula explained above. This will allow you to deduce if the conversion rate increased or decreased as a result of the update.
- Creative set testing
Another way of testing in the App Store is creative set testing (CST). This involves running Apple Search Ads to showcase different variants. The best performing variant can then be selected in terms of downloads and conversion rate.
CST could be created by following these steps:
- Go to the Apple Search Ads page.
- Determine the Storefronts and Ad Groups in which you want to run the test (should be enough traffic to get a significant result).
- Go to the ad group.
- Go to the Creative Sets tab.
- Add Creative Set for Variable A.
- Give it the correct descriptive name.
- Make sure you select the right language.
- Select the screenshots for this variable.
- Click save.
- Repeat process for Variant B.
- Repeat the process for all ad groups you want to run the test in.
- Product page optimization (A/B testing in iOS)
Product page optimization (PPO) is Apple’s in-house A/B testing solution for your default product page. This feature will allow you to run tests on organic traffic (Browse and Search) for icons, promo videos and screenshots. Three different variations can be created and tested for up to 90 days in App Store Connect. After the test begins, you will be able to see impressions, downloads and conversion rates. The internal Apple Bayesian statistical model will calculate and show the uplift of a certain iteration/change.
Since Apple still hasn’t launched its planned feature for A/B testing, we can use Google Play guidelines as a case study to learn the best practices. (Please note: these are subject to change once A/B testing in iOS is live.)
All tests should follow these rules:
- Only one iteration (change) at a time should be tested (otherwise you will have no idea what influenced your results)
- Tests should run for at least 7 days
- Sample size should be of at least 1,500 first-time downloads per variant — this could be adjusted per industry and market
You can showcase your results to the non-technical audience by presenting the percentage of change in terms of impressions (unique devices), first-time downloads or most importantly, conversion rate.
Take action based on your results
In order to make informed decisions regarding your conversion strategy, the Bayesian model could be leveraged, which is when you use your most recent data to make your next test results more accurate. This concept allows you to incorporate any findings from the previous experiment into the new one, improving the creatives which work, one by one. Watch this for an in-depth tutorial on the Bayesian model.
To better understand how decisions could be made based on the results, we’ll look at an example analysis of an A/B test we did on Google Play. We had two creative variants: one with a darker background color and one with a lighter background color.
To make sure that we get accurate results, we made our sample size larger than 10,000 downloads. (Keep in mind that the sample size can vary from industry to industry, but usually 1,500 downloads is big enough.)
For this test, we targeted first-time users (first-time downloads in the App Store).
Our results show that:
The dark background has a 90% confidence interval that the change in conversion rate will fall between -0.7% and +3.8%, with a most likely outcome of converting 1.55% more first-time installers than the control. The test is considered a WIN if the confidence interval shifts to a positive uplift or if the lower interval is positive (green). It’s a POSITIVE TIE if the 25th percentile is >0. Dark background in the following test could be considered a positive tie.
The light background has a 90% confidence interval that the change in conversion rate will fall between -0.5% and +4.5%, with a most likely outcome of converting 2% more first-time installers than the control. The test is considered a WIN if the confidence interval shifts to a positive uplift or if the lower interval is positive (green). It’s a POSITIVE TIE if the 25th percentile is >0. Light background in the following test could be considered a positive tie.
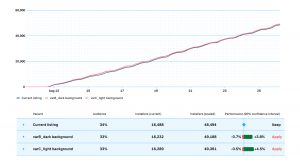
While it’s recommended to wait for a winner to be declared, if you don’t see a clear winner after at least 14 days, the test can be stopped or applied (in case of a win). In this example, there’s enough confidence that the light background is the better variant to use, and we can apply this and measure later whether there’s a positive uplift in the conversion rate.
Remember: it is important to measure the actual uplift in conversion after applying an experiment to confirm that it had the desired impact. Also, every time you find a new, higher-performing variable, you need to use it as the control variant. This way you can be sure that the next variable you change is monitored properly.
Conclusion
It can be tricky to navigate the new iOS 15 update but it’s still as important as ever to test and track your changes.
If you need specific ASO advice, reach out to us on ASO Stack and one of the Phiture team will be in touch!
Table of Contents