You’ll need to be prepared for this Journey.
I’ve had a lot of fun working on mobile apps for the past 4 years, from marketing to data analysis, through to actual app development in SWIFT.
Working for startups to big brands, I learned how the company size changes many things about the way you handle each part of the Triforce spectrum (marketing, tech & data). However, one thing I found common within every single company I had the opportunity to work with is tracking; how having a structured, clean and thorough tracking plan (i.e. taxonomy) makes all the difference.
A tracking plan can help tech teams to understand what is wrong in the product, data analysts to understand clusters and patterns between users, and marketing teams (in Growth, UA and CRM teams) to drive greater impact on acquisition, retention, and monetization downstream metrics.
So, what is the secret? What makes a good taxonomy document and how can you leverage it to define hypotheses and run data-driven experiments that are successful?
I’ve been on both sides: as a marketer using the tracking plan, and as a developer actually integrating the events in the code. I created a decent method that I have applied for many different clients, and thanks to my great colleagues at Phiture, especially Alex Gorius, we made it awesome — here it is.
1) Starting out: What are your goals?
When launching a new app, you should spend time defining what you are trying to achieve.
Quoting Simon Sinek here, you should first ask yourself “why?”
This question will help you understand what your analysis goals are.
Here is an example: let’s say you’re a dating app.
Why do you exist? To help people meet.
Helping people meet is your endgame. As this is your endgame, your goal is to get people to date -> so first discuss in the app -> match -> swipe.
Here, you’ll want to look at how much time people spend swiping, how many matches they have, and how many conversations they start.
Tracking these events will help every team:
- Marketing: What is the ratio between match and conversation started? Should you focus more on getting users to swipe or to continue started conversations?
- Data: Too many left swipes may indicate a problem in the matching algorithm.
- Tech: Too many “no replies” may indicate a problem filtering active users (instead of showing old accounts) and will impact retention.
Sure, tracking real-life dates is not possible. But you may be able to proxy it with user surveys and logging an event when a user shares a phone number (detecting 10 digits in messages).
2) Tooling: How to achieve your goals
Selecting the adapted tracking tooling is one thing. Being able to build a good tech stack is something else. If you want to hear my take on how to build a good tech stack and how it can be leveraged by your teams, click here.
Each tool has its strengths and weaknesses, but I often advise going for Amplitude or Mixpanel for Analytics tracking and Braze, Leanplum or Clevertap for CRM. This is just my personal take, from years of experience with the tools.
Depending on your vertical & goals, you may want to go for a different solution. I advise going for a tool demo and trying to understand how the tool’s clients are currently leveraging the data in your vertical. For example, E-commerce is completely different from a casual game and may require different features (such as needing to look at Revenue within the Analytics tool or needing UA Data piped directly from your Mobile Measurement Partner to your dashboards).
Should I use a CDP (Customer Data Platform) / Multiplexer? (e.g.: SnowPlow / Segment / mParticle)
CDPs are platforms that create a persistent, unified customer database that is accessible to other systems. Data can be pulled from multiple sources, cleaned then structured around a single customer profile. This structured data is then made available to other marketing systems.
CDPs are great, but they’re not for everyone.
For a CDP to make sense, you need to have multiple data sources that you want to gather in the same location and want to cross-reference to build relevant dashboards. For example, if you’re trying to pipe Intercom data to a warehouse, while also receiving analytics events from web & mobile products for further SQL analysis, then you may want to consider a CDP.
CDP also makes it easier to integrate new tools to your tech stack by providing “lightweight” installation and server-side integration.
3) Taxonomy: The magic spreadsheet
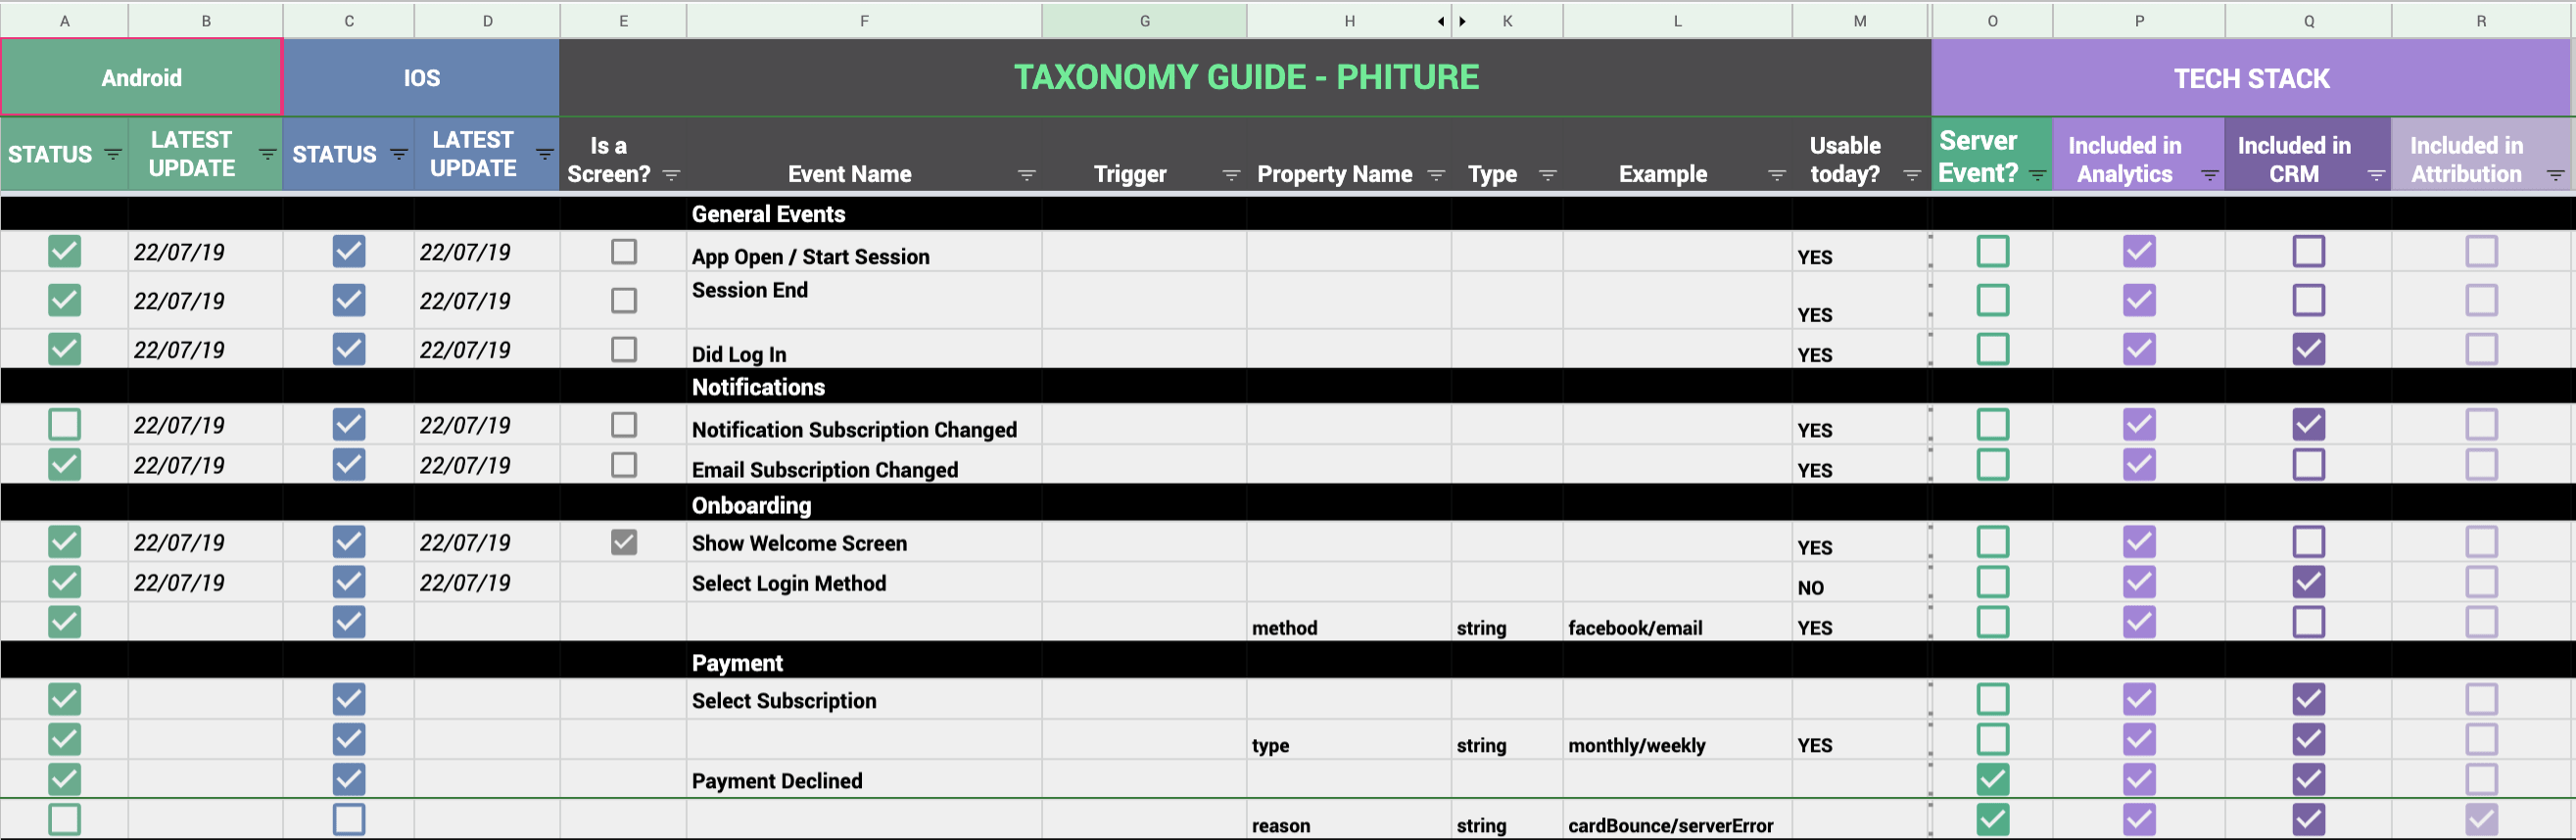
Our taxonomy template, the only document developers, analysts, and marketers agree on!
Many analytics tools recommend a template document to track events. It’s often a good start and will need some adjustments based on your app. Above is a screenshot of Phiture’s version that we recommend to our clients.
Get a copy of the taxonomy spreadsheet here.
Our Taxonomy document is split into the following tabs:
- Events, Event properties & Screens: Basically all the actions the user can take, and the screens the user can see in the app.
- User Attributes: All user-level data that is updated through the lifecycle. This includes anything from email address to subscription status to user acquisition source.
- Deeplinks (optional): This is our preference at Phiture. We like to keep all the deep links schemes in the same document as the taxonomy, but some companies may want to keep schemes in a tool like Confluence.
- Integration Sprints (optional): Being able to provide new data points you want to track with details around the trigger, the use cases, etc. is a great approach to cross-team collaboration. In doing so, marketers can request specific data points and developers can define a product sprint they’ll include these in. In order to work, integration sprints need real involvement from the different stakeholders.
In summary, this taxonomy document will help you maintain a good overview of everything you’re currently tracking and the state of each data point, type of event, etc.
It’s critical to keep this document up to date as it will serve not only as a reference for your integration team/developers to update the product but also as a tool for your marketing & data analysis team to understand what events they need to look at every stage. It will also help teams be aware of different discrepancies that happened in the past which may skew some reports they want to create.
When I’m talking about data points, this includes every action the user is going to take that is going to be tracked and any information you may want to save about the user.
You can split the data points into the following:
- App Screens (= events): The action of seeing a specific screen within your app (e.g. seeing the first screen of the onboarding flow). This is mostly used to track funnels (e.g. purchase funnel, content creation or onboarding)
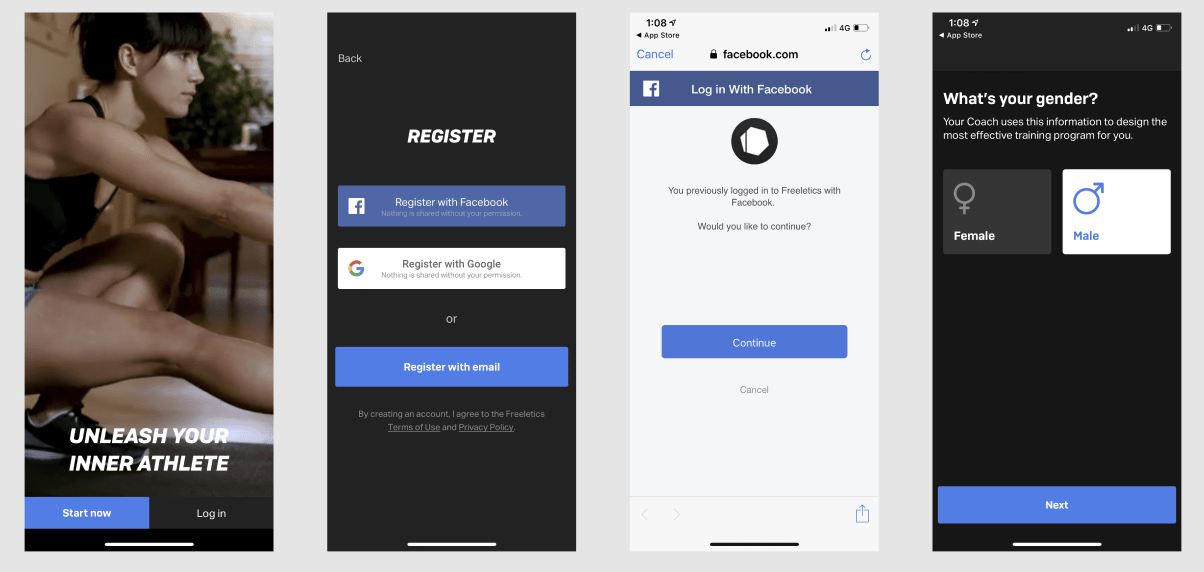
E.g.: Freeletics onboarding can be tracked with App Screens to detect drop-offs.
- People updates/user attributes: For example, if your user changed their rank and unlocked the premium version. User attributes are for anything that relates to a permanent change/update to your user data.
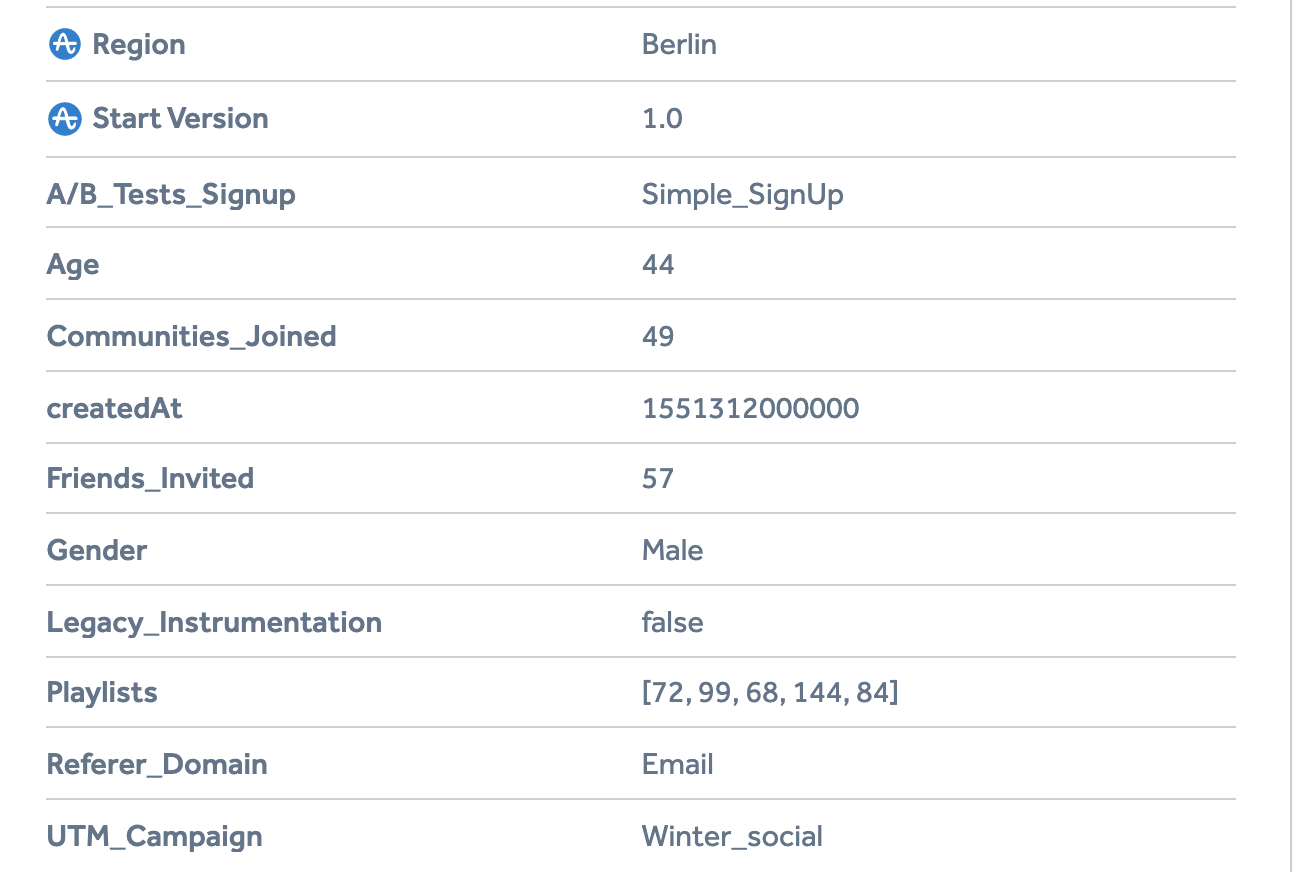
A user-level view with different attributes (Amplitude)
- Actions / Events: All the actions the user can take within your app (e.g. order a cab, like a post, etc.). This will allow you to measure feature(s) adoption, complex funnels, etc.
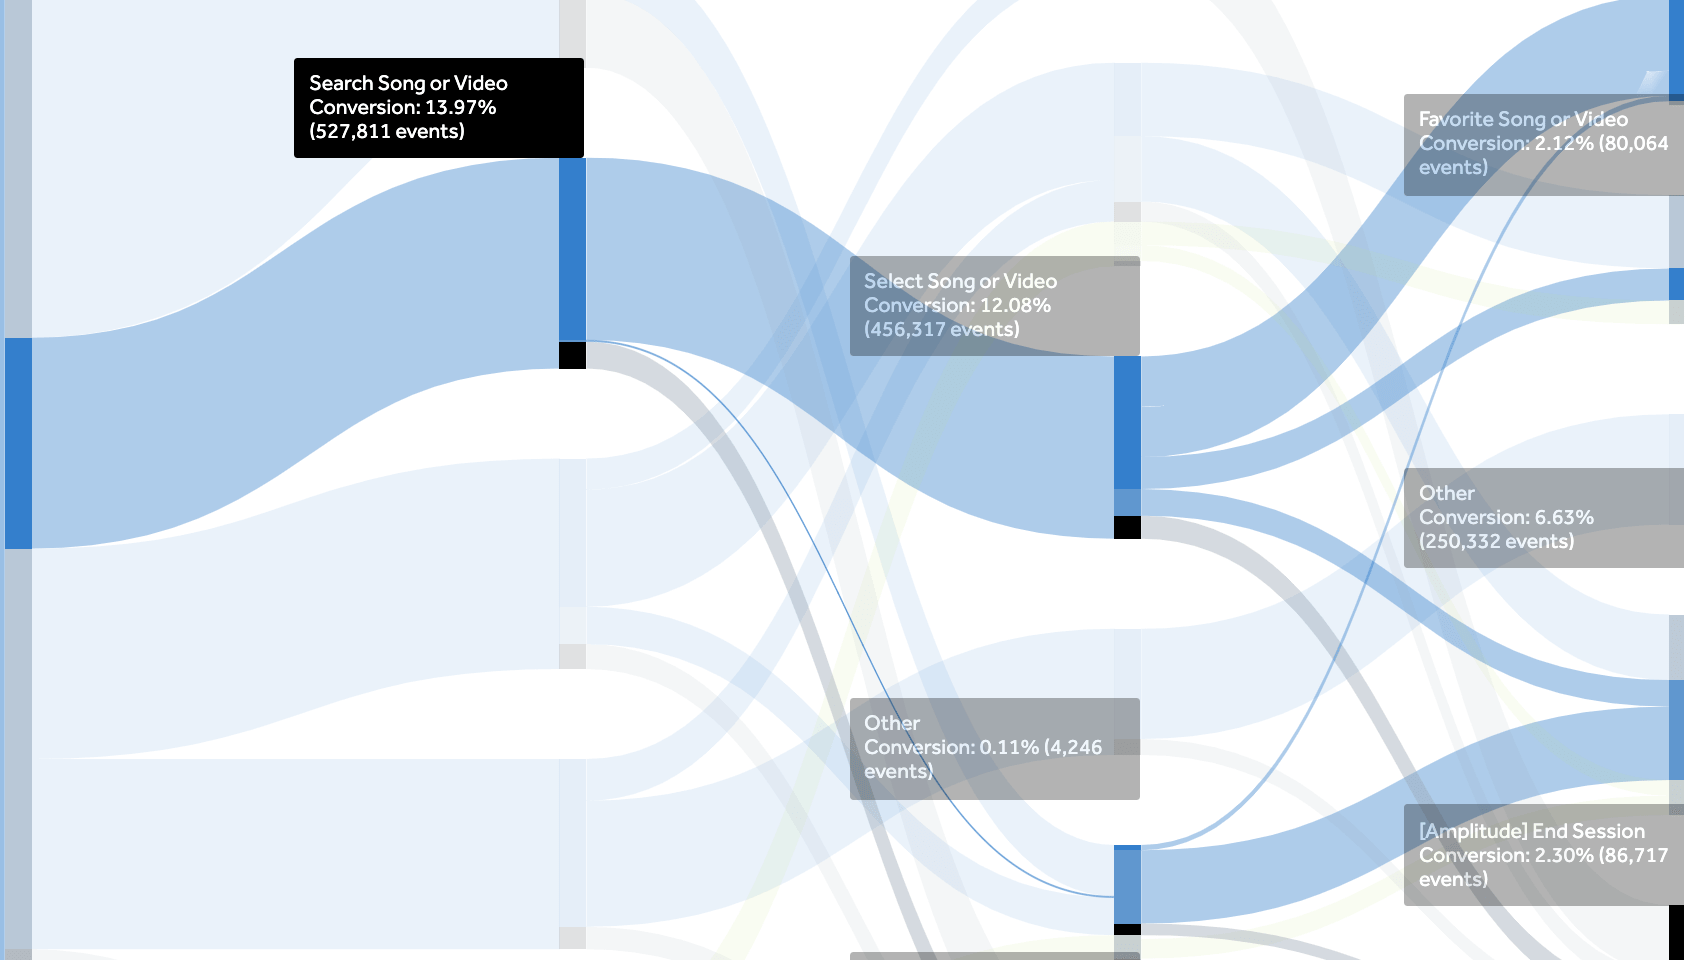
An event flow example for a streaming app (Amplitude)
Our version of the tracking plan is somewhat inspired by Mixpanel’s & Amplitude’s templates, though we added a couple of columns that we find useful:
- Example: A sample example of a data point
- State iOS / State Android + Update Date: Allows you to understand what platforms are supported by a data point and when it was last tested (or integrated) so you know how far you can look back for analysis purposes
- Server-side event: Allows you to understand if the event is triggered by the product or the server. This is helpful for two reasons: We won’t track server-side events as an activity by the user and some types of CRM campaigns can’t be triggered by a server-side event (in-apps mostly).
- Tools supported: You won’t be tracking every data point for every tool you use. This helps you understand which data points are available in each of your tools (CRM, Analytics, Attribution Provider).
- Old Naming & Discrepancies: When looking back at data, often you might find yourself looking at an event that has been obsolete for 3 months. Having a single source of truth helps to clarify what events you should look at for each action the user is taking and saving previous event naming conventions and any discrepancies (can be related to a new update, tool crash, etc.) is a good way to make sure you’re aware of every issue that could impact your analysis.
Naming Convention 101
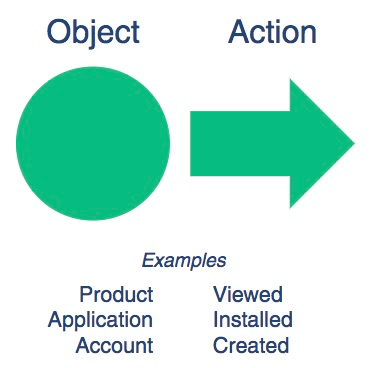
The main approach recommended by Segment
Before thinking about crafting a tracking plan, you should define your naming convention, which is the way you’ll write each event in the plan, as well as in the code.
Having a clear, consistent naming convention will make your taxonomy document the single source of truth on how each event is named and appears in your different tools.
I won’t write on this as Segment already did with this post on their blog. It’s the best material on the topic. It highlights best practices and gives you a good process to define your own naming convention.
Analytics vs CRM: Understand what to track
The first thing you may want to define is what to track: should you be exhaustive in the way you approach data tracking, or should you limit it to the main funnels & actions you’re interested in looking at?
Tracking costs money. Most of the analytics tools have a cap on the number of data points you can send to them. Also, when looking at advanced CRM tools such as Leanplum, Braze, and Clevertap, they also charge based on the number of data points you’re tracking.
This is why you need to be careful about each data point you decide to track and make sure you’re not tracking useless data.
Here I give our approach to define what you should track within your product. I advise adjusting the approach based on your needs, however, this will give you a good high-level strategy.
You should ask yourself all these questions for both new and already integrated data points.
If, after asking these questions, you don’t find at least one use case for each data point, you should not consider integrating the data.
🥇6 good reasons to track a new data point🥇
- Is this data point is valuable on the company level? (Company KPI’s)
- What analysis are you trying to achieve by tracking this specific data point? (Funnel analysis/testing feature adoption etc.)
- Is there a specific campaign that you can trigger based on this data point? (e.g. you may want to show an in-app in the profile page to prompt the user to add their email or you may want to send a win-back campaign for users who start the purchase funnel but never finish buying the subscription).
- Is there a specific segmentation that is not possible without this data point? (e.g. you may want to educate users on a specific feature in the app if they have never used it before)
- Do you need a specific conversion event to evaluate the success of a campaign? (e.g. from users receiving an email, how many actually purchased a premium account)
- Does this data point enable copy personalization for relevant CRM campaigns? (e.g. most ordered type of food for a delivery app)
Understanding event properties
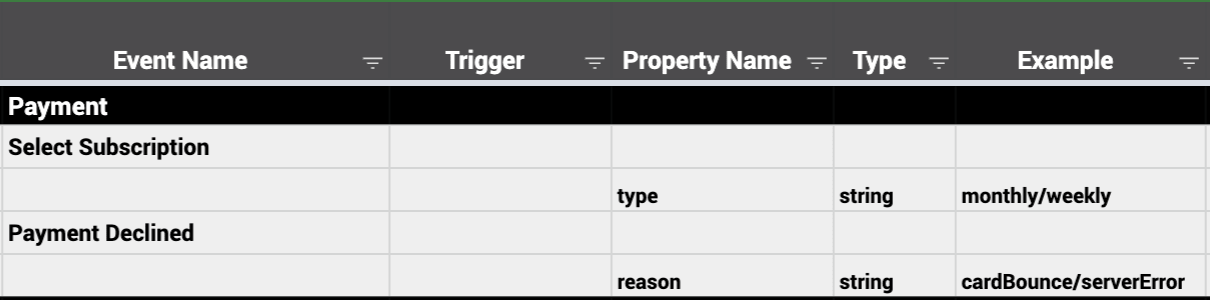
Event properties add contextual information about an action
When tracking events (actions), you can also track data within specific events (event properties). An event property is a variable attached to an event that will give you additional information regarding a specific action the user is taking.
For example, if the user triggers the event Play Song, you won’t get much information with this alone. You may also want to look at statistics based on the most played genre for example.
For this, we can add the following event properties:
- artist: song’s artist
- duration: how long the user listened to the song
- name: song’s name
- category: style (country, folk, hip hop, etc.)
In some contexts, you may want to add advanced event properties such as:
- fullListen: Did the user play the full song? Duration won’t be enough as each song has a different length.
- mode: If your app has a background mode, you may want to know if the user listened to a song with it, or if they remained in the UI.
Again, these examples may be valuable in specific cases. Don’t consider them necessary until you can define why.
Understanding User attributes
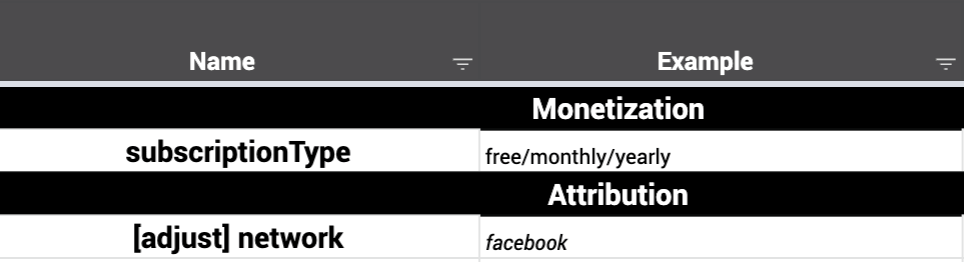
User attributes give an opportunity to segment users easily
There are also variables that can be attached to a user (e.g. gender, city, accountType, etc.). The difference between event properties and user attributes is that you can access user attributes anytime, but the value available will be the latest one., whereas the value of an event property can change each time the user takes an action.
Be careful with sensitive data. Date of birth, name and first name are rarely useful in data analysis but may be valuable for CRM experiments with copy personalization, so you may consider tracking these data points only in your CRM tool.
After you think about basic user attributes, you can also consider some more advanced data points:
- numberOfSongsPlayed: How many songs has the user played since their first install? This can help you build data summary emails.
- accountType: Is your user a premium user?
- numberOfAlbumsCreated: How many albums has the user created?
User attributes are often more useful to do segmentation in analytics tools, instead of focusing on event-level data. Attributes can also help to build advanced cohorts.
A/B Test Variables: Should they be included in the Taxonomy?
If you’re planning on running multiple A/B tests on the product side, you may want to define variables in the taxonomy. This will make it easier for every team to know what aspects of the app they can tweak without any app update.
A/B test variables are set up on the product side, and can usually be changed for a specific segment of users from a server app. This can be achieved within a custom setup or by using a tool such as Apptimize or Firebase. Also, some CRM tools like Leanplum allow you to do it.
Even if the biggest use cases will be games where you can combine CRM efforts with game economy tweaks, onboarding adjustments or purchase funnel optimization, it still makes sense for apps where you may consider tweaking prices for some segments of users, changing the onboarding messaging or even making new features available for a specific segment (with a CRM approach, educating users on it).
If you decide to integrate variables in your taxonomy, there should be an extra tab that will include the variable, the app version where it’s available, the default value and the different features/aspects of the app involved.
Understanding & helping your developers
Once the tracking plan is drafted, you will need to discuss it with your engineers to understand what is feasible and what is not, based on the app structure.
In your mind everything will look “fairly easy”, but I’ve been on the tech side, and some data points are hard to track. It’s important to get developers involved in the process to make sure you spot issues early.
How can you help your developers with tests?
It’s laborious work, but once a new app version is released, you may want to test the different new data points that have been integrated in the app.
If you’re working in the CRM team, there are some things you may consider testing for new data points:
- When is each event triggered?
- Is it a server-side event?
- Are event properties correctly populated? (with actual values and not default values)
- Is there any new user with a specific user attribute that has an empty value? (e.g. even after location is prompted, you may have some users that have a null location).
Something I wish I had known when I first implemented tracking
Your developers will probably have a specific approach to data tracking. It makes total sense to listen to them.
From my experience, I’ll just highlight the fact that you’ll change more than once the tools you’re using to track and send events to the Analytics, Attribution Providers (also called Mobile Measurement Partners — MMP) & CRM tools.
That’s why I highly recommend using a generic class that handles all the tracking for you. This means that you won’t tag each event for a specific SDK, but actually track it once with your generic class, and let the class distribute the events.
Here is a basic snippet of what it would look like in SWIFT (iOS).
import Amplitude_iOS
import Mixpanel
import FirebaseAnalytics
class AnalyticsHelper {
static func log(event name: String, properties: [String: Any] = [:]) {
// Amplitude:
Amplitude.instance().logEvent(name, withEventProperties: properties)
// Mixpanel:
MixpanelInstance.track(name, properties: properties)
//Firebase:
Analytics.logEvent(name, parameters: properties)
}
[…]
}
This is just one of the functions available in my AnalyticsHelper class.
Let’s say I want to track when a user adds a note to my productivity app:
AnalyticsHelper.log(event:”Add Note”, properties:
[“type”: “personal”, “group”:”My Daily Routine”]
In one single line, I’m actually sending the data to Amplitude, Mixpanel, and Firebase.🤯
My Analytics Helper also includes other functions to track screens, user attributes (unique or incremental), identify users (emails, name, date of birth, etc.), set up Unique IDs for signed-in users (consistent in all tracking tools), update subscription status (push & email / on device level or app level), and so on.
Every single data point I’m tracking from the product goes through this class, making it way easier for me to update the tools I send data to or the way I track any data point.
Conclusion
Building a good taxonomy document will help your Marketing, Tech & Data teams align on what is currently tracked and what you should integrate in upcoming sprints.
A first step in leveraging data to drive impact is to actually have a good setup, and I hope that with this guide you’ll be empowered to drive impact on your core metrics.
In the second part of this series, I will focus on what happens once you have a good taxonomy in place, where everything is tracked correctly and you can run all the analysis you want. What should you look at? What experiments are worth running? And how do you define where to focus?
I want to thank Andy Carvell, Alex Gorius, Tessa Miskell and Martijn Janssen for their insights 🙂
Cheers.⚔️🧙♂️