This guest post is the final part of a three-part series, tackling the heuristics of conversion, and was written by Phiture alumni Mateusz Wrzeszcz, a specialist in Global App Store Optimization and CRO @ Klarna. We encourage you to read the first two articles in this series, Supercharge your App Store Optimization with our Product Page Analysis Cheat Sheet, and Ironclad Questions to Help Structure Your Product Page Optimization, for a deeper understanding of the theory that underpins this methodology.
On the surface, an app store product page can appear to be a relatively simple landscape. Yet, once you start to drill down and ask the right questions, it becomes pretty clear that packed inside that tiny space are countless variables that can influence your app’s conversion rate (CVR). Therefore, it is not enough to simply ask the right questions; you also have to understand how to interpret the answers and translate those results into a prioritized testing strategy to give you those insights that can lead to real CVR gains.
That is why, in designing our Product Page Analysis Cheat Sheet, we didn’t just stop with a rock-solid list of questions to help analyze your app store product page. We have also included a “Results Page” with a handy radar chart to help you clearly visualize the aspects of your product page that are hitting the mark and where it could use a little work. Additionally, there is a third page of experiments and recommendations covering every facet in our list of questions. So, no matter what your page’s strengths and weaknesses may be, you will never be left wondering where to begin in your testing and experimentation.
Understanding the Results
Once you have run your product page through rigorous examination, it is time to review and interpret the findings automatically populated and quantified on the second page of our Analysis Spreadsheet. Like the list of questions that make up the first page of the Analysis Cheat Sheet, we’ve broken the results page down into the four sections modeled after our Heuristic Analysis Pyramid.
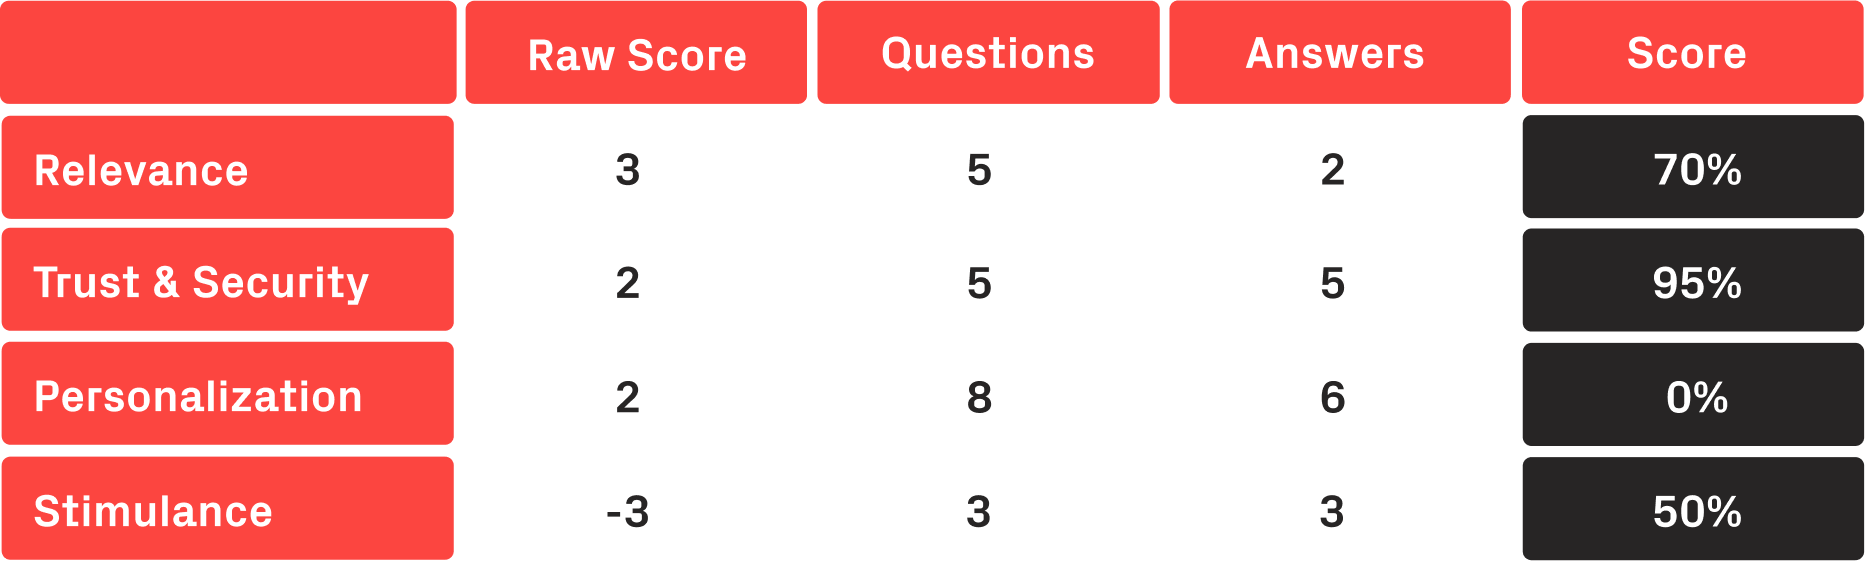
A table displaying scores in relation to qualitative questions to structure your research.
Each section is then divided into its respective subcategories on the left, followed by columns dissecting the hard data of the analysis on the right. First in the rows of data is the “Raw Score,” which shows the total points awarded to that section based on the simple points system built into the list of Audit Questions. As not every question will apply to every app store, we’ve followed that up with a breakdown of the number of questions asked as well as the number of answers you have given to ensure a “non-applicable” question is never applied to your actual results. Finally, on the far right column, you will see those results for each subcategory, ultimately tabulated together to give you a total score for each section of the analysis.
Those section scores automatically generate a radar chart to give you a visual representation of your store listing’s strengths and weaknesses, broken down into the four main conversion areas. As you can see in the example above, scoring a 95%, this product page is flourishing in the area of “Trust & Security.”
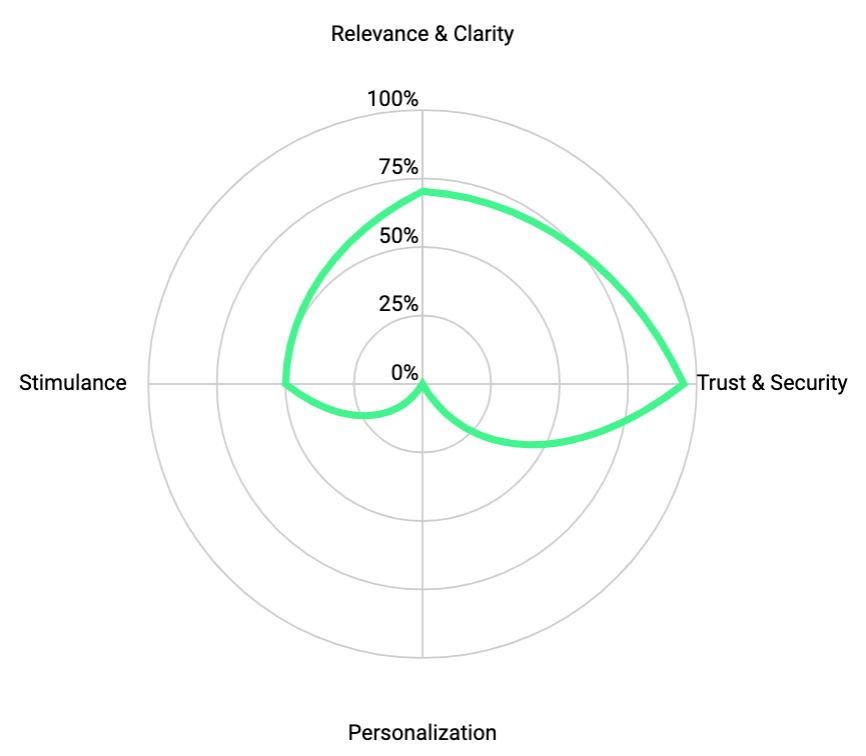
A graphical representation of where an ASO professional needs to concentrate their efforts.
While “Relevance” and “Stimulance” are not as strong, scoring 70% and 50%, respectively, it is the area of “Personalization,” with a score of 0%, that assuredly needs the most work. It is important to remember that this visualization does not show whether you are doing good or bad but empowers you to understand which areas most need your focus. It is up to you to factor details like your app’s category and purpose into these results to prioritize a robust testing strategy informed by this reliable data and rigorous research.
Prioritizing your experimentation
Once you have used the Results page and Radar Chart to analyze your audit findings, it is time to craft a prioritized experimentation plan to give you insight into how to optimize those weak points in your product page. At Phiture, we understand how difficult it can be to look at your research, analyze your findings, and then actually develop the next steps to address your PPO needs. So we created the third and final page of the product page analysis spreadsheet to give you prioritized recommendations for experimentation and improvement, ensuring you always have a path to follow toward your optimization goals.
Based on your audit results, the Cheat Sheet automatically analyzes the data to produce a list of experiments and recommendations addressing every component of each section of your research. In the first column on the left-hand side, you can see those experiments clearly prioritized in a color code to help you create your testing strategy. Red for experiments that are “Highly Important,” yellow for tests that are “Worth Considering,” green for areas that are “Not Urgent,” and white for the aspects of the audit that are “Not Applicable” to the needs of your product page.
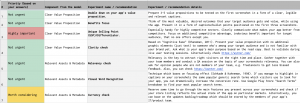
A screenshot of the Experiments & Recommendations tab.
As you will see in the second column, the list of recommendations is arranged into the four main conversion areas, then broken down and labeled as to which component of the model they are addressing. This information is more critical than it may seem, as the more detail you know about the focus of each experiment and recommendation, the better you will be able to prioritize your testing to the specific needs of your PPO. Like every aspect of the Analysis Cheat Sheet, the prioritization color code is not a solution to your product page’s needs but a suggestion on where to begin and how to proceed. It is up to you to use all of the information at hand to fine-tune your plan of attack.
As you move further right through the Cheat Sheet’s columns, you will see the name of the experiment or recommendation, followed by a detailed explanation of its execution. Following the details section of the Spreadsheet, we have included a column to show which element of your product page’s Metadata to apply this recommendation to and another column detailing the suggested method of application. Last but not least, there is a checklist column to help you work your way through your prioritized list toward your optimization goals.
It is a good idea to read through every aspect of the Experiments & Recommendations page before you start scheduling your experimentation, as each column of this final page of the Spreadsheet should be taken into consideration when prioritizing your testing. For example, a recommendation prioritized by the Cheat Sheet as “Worth Considering” but only requiring a quick manual check may take priority over another “Highly Important” experiment requiring a complete A/B Test. Or, perhaps your graphic designer is still wrapped up in another project and won’t be able to get you the variants you need to A/B test some improved visual cues on your new screenshots. Then, simply deprioritize any experiment or recommendation with “Screenshot” in the Metadata element, and focus your testing on the copy of your descriptions, so not a moment is lost in your optimization efforts.
Just one piece of your PPO puzzle
While these recommendations and experiments are certainly not the only way to address areas needing optimization, they do serve as a dynamic set of thought-starters to guide you in formulating your specific testing schedule.
As powerful as this Product Page Analysis Cheat Sheet is in auditing your App Store Product Page and guiding your testing and research going forward, it is just one part of an entire systematic process for app store optimization. When incorporated into a tested and proven blueprint like our Conversation Rate Optimization Loop, The Analysis Cheat Sheet can be your secret weapon to set you on your way to big-time CVR gains.
What next?
Now that you’re more familiar with the experimentation suggestions of the Product Page Analysis Cheat Sheet you can follow the link and start working with the sheet from today.
We encourage you to read the first two articles in this series, Supercharge your App Store Optimization with our Product Page Analysis Cheat Sheet, and Ironclad Questions to Help Structure Your Product Page Optimization, for a deeper understanding of the theory that underpins this methodology.