This is a guest post by Roman Garbar, Product Manager, Business Intelligence & Ad Ops expert, and Mobile Marketing enthusiast.
Before you start, make sure you have read my previous article about installs discrepancies. These topics are closely connected.
We are continuing our journey into understanding the data discrepancy in the world of mobile marketing. This time we will take a look at another important metric. Some would say it’s even more important than installation. I’ll give you a hint, it’s is used to pay your expenses. You guessed it. Today we are going to talk about revenue.
Why should I compare revenue?
- You will be able to see your earnings & accurately calculate all related metrics;
- You will be able to find the traffic sources that bring in money;
- You will be able to detect users that are cheating within your app;
- You will be able to spot traffic sources engaging in fraudulent activities.
Where should I be comparing revenue?
- Attribution platforms;
- Analytical Dashboards;
- Play Console (Android) & App Store Connect (iOS);
- Bank accounts.
Gross vs Net
Google and Apple should also make their living somehow, right? This is why they take 30% of each purchase made within your app.
Both Play Console & App Store Connect can show you what users have actually paid (gross revenue) and what you will receive (net revenue). Make sure you are using the right report when comparing it with your data. And if you are passing the revenue from the app to somewhere else don’t forget to deduct this 30%. Of course, there are different cases when you need to use gross or net revenue. When you are negotiating with investors you might want to show the gross revenue, but when you are calculating ROAS it’s advised to use net revenue.
EU & VAT
Source: SlideShare
These two abbreviations are the reason why your profits might be halved.
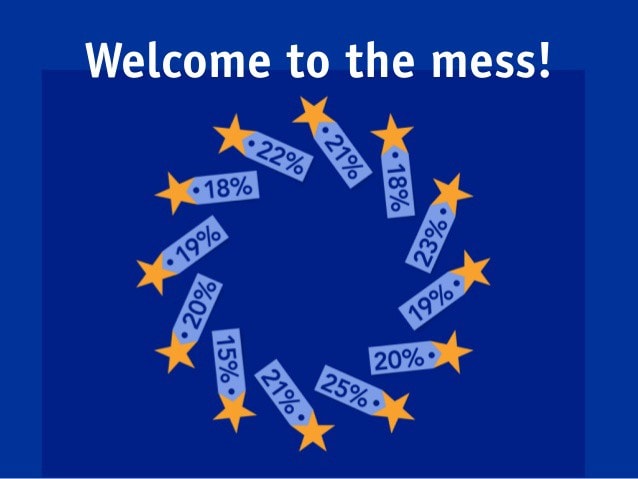
The thing is that payments from the European Union (EU) users are treated differently by app stores. This is due to the value-added tax (VAT) law that was accepted in the EU in 2015. Back then everyone was discussing it, not GDPR. That’s when Google and Apple became responsible for paying VAT for all purchases made by EU users.
Keep in mind that each EU country has its own VAT rate. To make things a bit clearer, let’s look at the example below:
A user from Estonia makes a $10 in-app purchase in our app in the Play Market. VAT in Estonia is 20%.
$3 goes to Google as platform commission and $2 will be returned to the Estonian government as VAT. The remaining $5 is what you earned for making an awesome app.
The good news is that net revenue reports in Play Console & App Store Connect already have it deducted. The bad news is that it’s going to be trickier to calculate it on your side. You will need to determine the geolocation of the users and deduct the corresponding tax rate.
VAT rates per country can always be checked on a corresponding wiki page.
What’s your currency exchange rate?
Your app is used by people from all over the world and they will use all kinds of currencies to pay for your product. Most dashboards display the revenue in USD. It means they use certain currency exchange rates. Try to understand how the system you are using for comparisons operates with foreign currency and try to do the same on your side. This way your final numbers will be closer.
Give me back my money
Sometimes people don’t like what they get and want their money back. We can’t blame them for it. However, we should always take into account those refunds.
Refunds are properly deducted in the reports of Play Console & App Store Connect. Third-Party Analytics doesn’t come out of the box with such a commodity, so you will need to put in some extra work. Basically, it’s recommended to track not only payments with positive values but also refunds with negative values.
Those Nasty Fraud Payments
Fraud has been the topic in the mobile industry for years, and rightfully so. Those swindlers are doing terrible things like emulating the purchases within your app without actually paying anything. Even the smallest amount of fraud can cause a significant discrepancy between figures in your bank account and analytics dashboard.
Fraud payments are used to:
- gain unfair user advantage within your app;
- artificially increase revenue metrics for a particular publisher.
Usually, that happens on the jailbroken devices so it makes sense to regularly look at the percentage of those devices among your users.

Source: Unsplash
Luckily, there is a pretty simple way to spot these perpetrators. It’s called receipt validation. Each real payment has a unique code (receipt) provided by the payment platform (Apple & Google) which can be validated by the vendors in real-time. If the code is not recognized by the payment platform, it means that it’s fraud.
Receipt validation is supported by most attribution platforms out of the box. Just turn it on!
What time zone are you in?
I’ve already mentioned this in the article, but it’s worth mentioning again. Before comparing any data, always check the timezone. If possible try to adjust the current time zone of the dashboard. Here is a hint on what time zones Google and Apple are using:
- Play Console: Finance Reports are based on the UTC time zone.
- App Store Connect: Finance Reports are based on Pacific Standard Time (UTC -8) time zone.
What is your estimate?
It takes time to count all of that money that the app store has helped you earn, so don’t expect to see accurate figures right away. App store dashboards provide reports that are generated daily (estimates) and monthly (final). If you want to see more accurate data, it makes more sense to look at the monthly reports than daily reports.
Also, don’t forget about the rule of thumb that applies to the comparison of any type of data. Don’t compare revenue data including the “Today” period.
It’s all about attribution
When you compare revenue by traffic source you can see different numbers per different networks. For example, the revenue amount in the Facebook platform will be different from the revenue in your attribution platform. The reason is that revenue and all other in-app events will be attributed to the point of initial install or re-engagement. If you figure out the reasons for installs discrepancy, you will be more likely to find it for revenue.
Do you know more reasons why dollars in dashboards are different from dollars in your bank account? Please let me know in the comment section below!
Table of Contents


