A simulation to uncover the reason of a drop in conversion noticed in iOS 11
A quick note about me: I am Luca and I work as a Data Scientist at Bending Spoons (yes, we are hiring in ASO/Marketing!) where I also coordinate the App Store Optimization team.
When iOS11 was released I literally freaked out 😱 as I observed a decrease in iTunes Connect reported conversion in many of the applications in our portfolio. I then decided to dig deeper and wanted to share my findings with you, given that I have recently seen many scared people asking questions about how to interpret changes in conversions, impressions and downloads on the ASO Stack slack channel, especially after the introduction of the new iOS11.
TLDR; jump to the Conclusions 🦄 at the end of the article.
Ahem.. Simulation?
Let’s start from the basics; a simulation is a very common tool for a data scientist. Simulations try to recreate complex phenomena and indagate whether our model work properly on the simulated data on which we have full control. Conversely, the most delicate part of any simulation is to try to make it as close as possible to the reality, by deciding the right parameters and initial assumptions.
In this blog post, we will try to analyze how the App Store work by simulating users, searches, impressions and downloads for both iOS10 and iOS11. We will then study the final distribution of these metrics to get a better understanding of what they mean.
If you are nerd enough to understand a tiny bit of Python and very simple statistics, this analysis is available as a Jupiter notebook here.
Three types of user behaviors
The first thing we need to model are our users. After a series of interviews with different people I realized that there are mainly three type of App Store users:
- Type A (Eager): this type of user will download the first app they like. Basically they will only scroll to the next app if they didn’t think that the previous one did they looked for. Their behavior is fairly consistent between iOS10 and iOS11.
- Type B (Normal): this type of user will scroll a certain number of apps and will then choose the one they like the most. The main difference between iOS10 and iOS11 for this kind of user seems to be that given a constant amount of screen scrolling in pixel, the user will be presented with more choices in iOS11. Technically speaking, the scrolling parameter in our population will be controlled by a normal distribution with different center parameters for iOS11/iOS10 and the choice of the app for a user is based on a weighted random sampling on the “true relevance” of the app.
- Type C (Curious): this type of user will scroll a certain number of apps and then install all they deem to be relevant, just to try them and uninstall those they didn’t like. The scroll behavior is fairly similar to the Type B user.
We now need to decide how many people will fall in the different categories. I conducted a survey among colleagues and friends and I decided to assume that we roughly have 50% of type A users, 45% of type B users and 5% of type C users. My sample might be biased but you can however re-perform my analysis using any other combination of user composition in my Jupiter notebook; results shouldn’t vary too much.
Creating an App Store
After defining users we need to create some apps and some search queries that the users will perform to find these apps. In this simplified model every app will have a true relevance, which is a parameter that determines the relevance of the app towards a particular search query.
We can assume the true relevance of our apps to be constant at a certain value (empirically I believe this value is around 70%-80% — after all if you searched in the App Store, apps showing up are highly relevant) or to let it vary according to a statistical distribution, allowing apps to randomly take values around 80%. My choice goes for the latter option as I think it is a more flexible representation of the App Store.
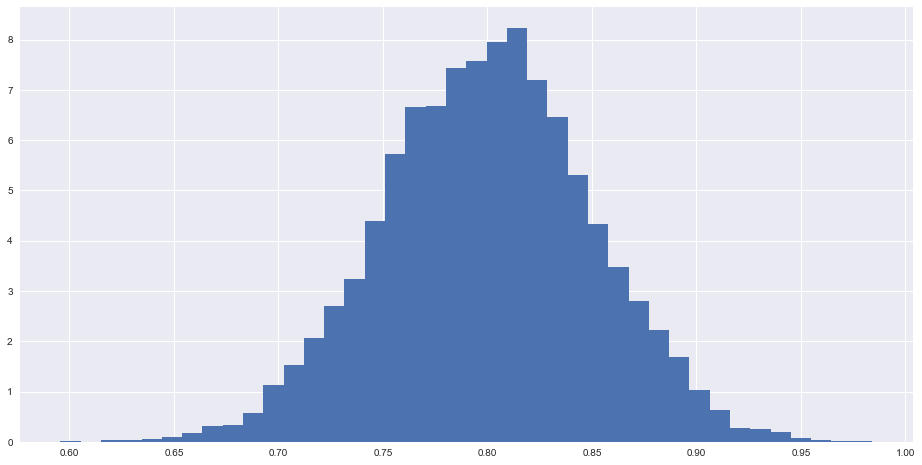
True App Relevance Simulated Distribution (normal μ=80; σ=0.05)
This metric what every ASO practitioner will try to maximize and there is clearly no way to directly measure it. Therefore we often use search conversion (erroneously as we will see) as a proxy for it.
Analyzing the results
To continue our analysis we generate 10.000 users each of whom 1.000 made searches returning 25 apps and then analyze the results of our simulated store given our initial choice of parameters.
We observe the following normalized distribution of impressions according to the position of the app in the search results:
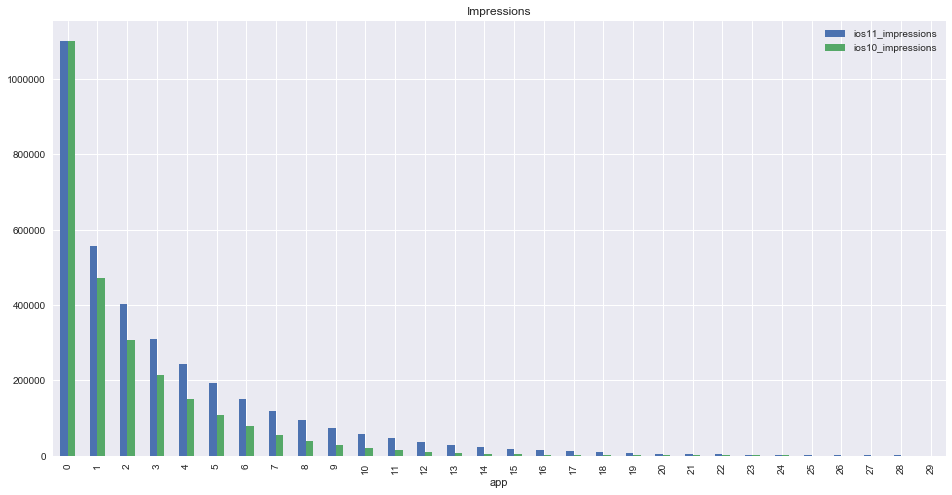
Observed Simulated Impressions per search ranking (iOS10/iOS11)
This is a fairly expected shape, the first app gets as much impressions in iOS10 as in iOS11 and then we have have a separation given by the different real estate given to the search results in the different iOS versions.
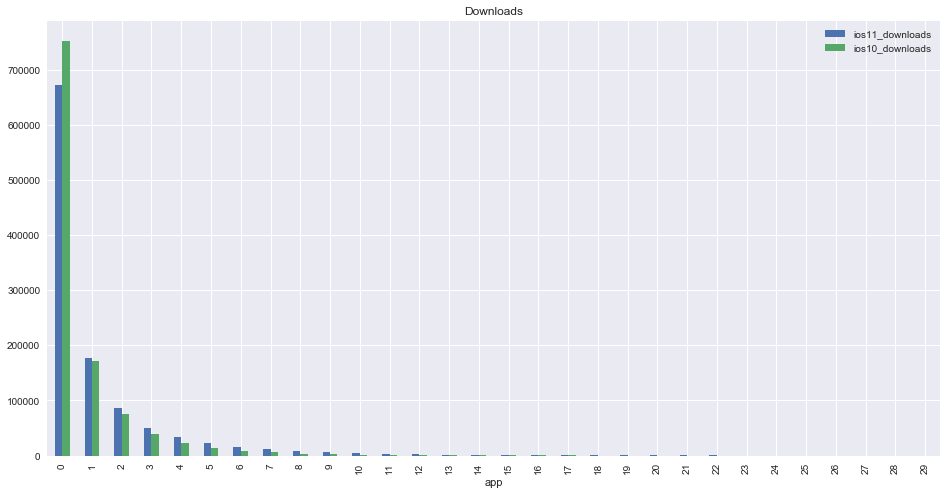
Observed Simulated Impressions per search ranking (iOS10/iOS11)
Downloads have an interesting shape. The first apps lose conversions due to the increased competition, and there is a switch point at which the iOS11 App Store gives you more downloads than the iOS10 one. If you have an amazing app that sits in the top 3 positions in all keywords in which it ranks for, then you might expect to lose a few downloads as iOS11 settles in. On the other hand if you decided to go for a more diversified ASO strategy positioning yourself in the middle of the pack in many keywords but you could observe a slight increase in downloads.
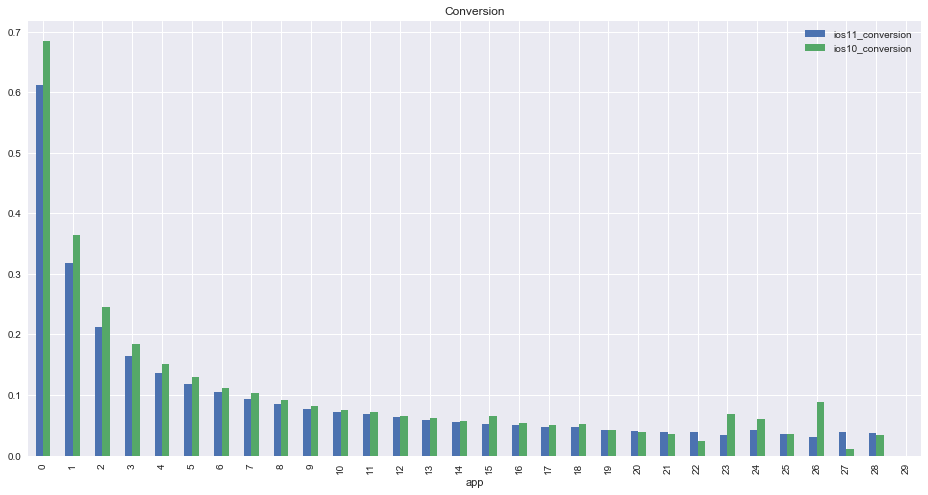
Observed Simulated Search Conversion per search ranking (iOS10/iOS11)
Search conversion defined as download-over-impressions (just like the one you see in iTunes Connect, apart from that our metric is filtered by Source Type = Search) is probably the most interesting thing to analyze. Excluding the right portion of the graph that has no statistical significance, as you can see the conversion at various ranking positions is not at all constant as you might expect. Basically this means that if you see conversion changes in iTunes Connect they might not be because your app is increasing its “true relevance” but just because it is moving in the keyword rankings (both for iOS10 and iOS11). For example changing your textual metadata might result in sudden changes in reported conversion (due to changes in search rankings). Note that the shape of this curve will be heavily dependent on your choice of parameters for the simulation, however it will never be constant unless you have only 100% of App Store users were type A users, which is clearly not the case.
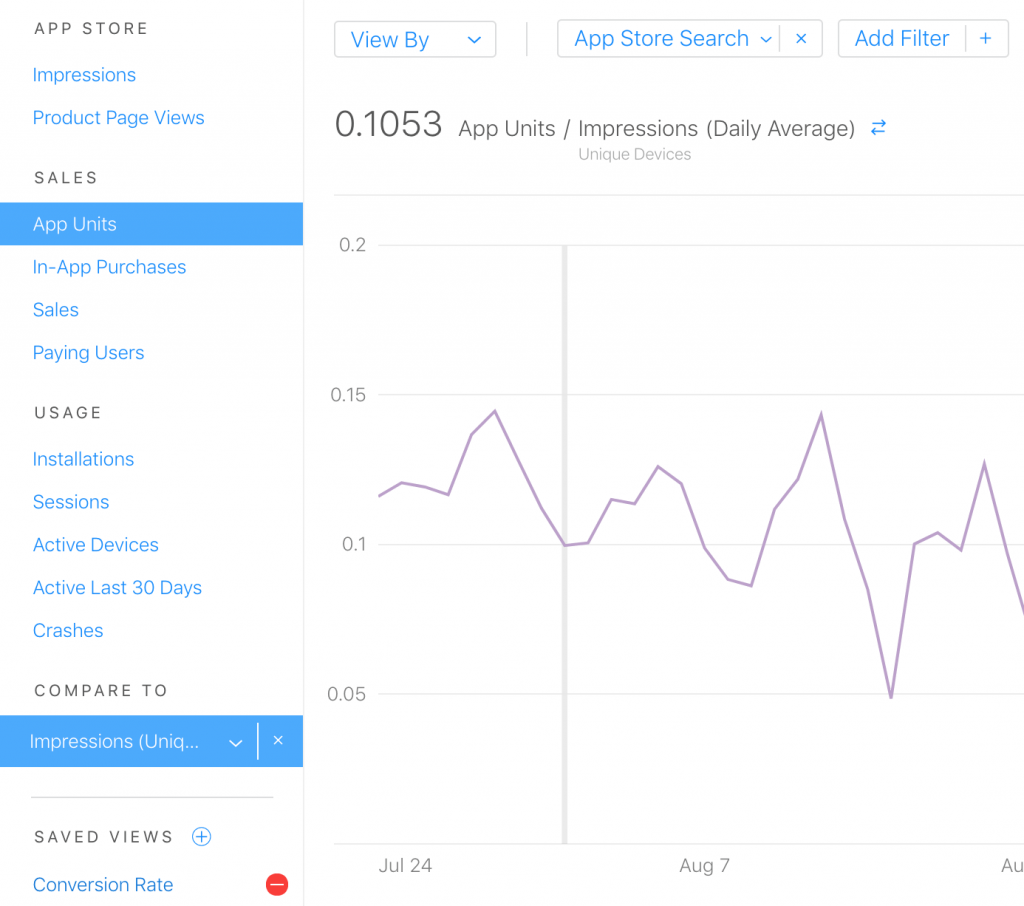
The “Conversion Rate” metric you shouldn’t trust!
Let’s then jump to the differences you should observe in this metric when your new users will shift from iOS10 to iOS11:
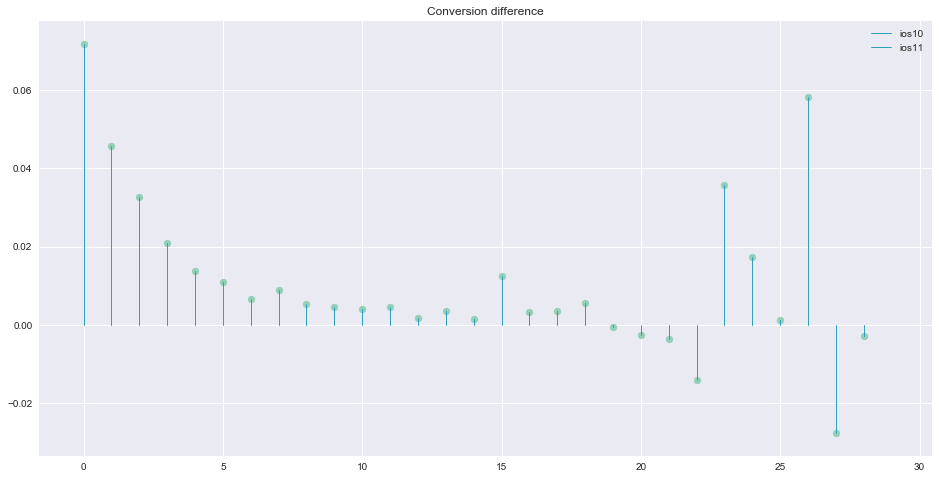
Observed Simulated Conversion difference per search ranking (iOS10/iOS11)
The drop in search conversion (as shown in iTunes Connect) between iOS10 and iOS11 is quite evident, and, once again, it has no real meaning on your downloads per se, so don’t freak out and rush update your app changing your creatives ; the change in conversion is simply a by-product of the new look of the iOS11 App Store.
Conclusions 🦄
- Don’t take decisions based at the conversion reported in iTunes Connect. Most likely it’s not what you think it is. If you want a slightly better proxy for conversion, look at your Search Ads conversion.
- It’s physiological to see a decrease in conversion reported in iTunes Connect with the spreading of the adoption of iOS11, but it doesn’t really mean you are converting worse or that you should be rushing to update.
- It’s you might get slightly more/less downloads or impressions with the introduction iOS11 depending on your ranking in the search queries that bring you traffic.
Notes & Remarks:
- This is a simple simulation which has few parameters that might be tweaked to significantly change the results (especially those about the downloads/impressions variation). However what is very important is that the conclusions on the iTunes Connect conversion are quite robust to the choice of parameters as long as you have a non-zero amount of Type B or Type C users.
- You might expect the app in the second position of iOS11 to get as much impressions as the first one. For the way we created our simulation you can think that we count an impression only when the screen fully shows the app, which doesn’t happen even in the new App Store. Given the fact that there are much regular rather than plus iPhones we think this is a reasonable result.
Have a great day ASO community :-)!

