Maggie Ngai, ASO consultant at Phiture, helps companies to optimize visibility and conversion of their apps in both App Store and Play Store through Apple Search Ads, CRO experimentation, & keyword optimization processes.
Search Ads Creative Sets provide an opportunity to improve the performance of app preview and screenshots in search results. They give ASO experts an understanding of what visual assets convert the most visitors. Calculating this can be complex, which is why Phiture has built an Apple Search Ads statistical significance calculator and tool to simplify this process.
What are Search Ads Creative Sets?
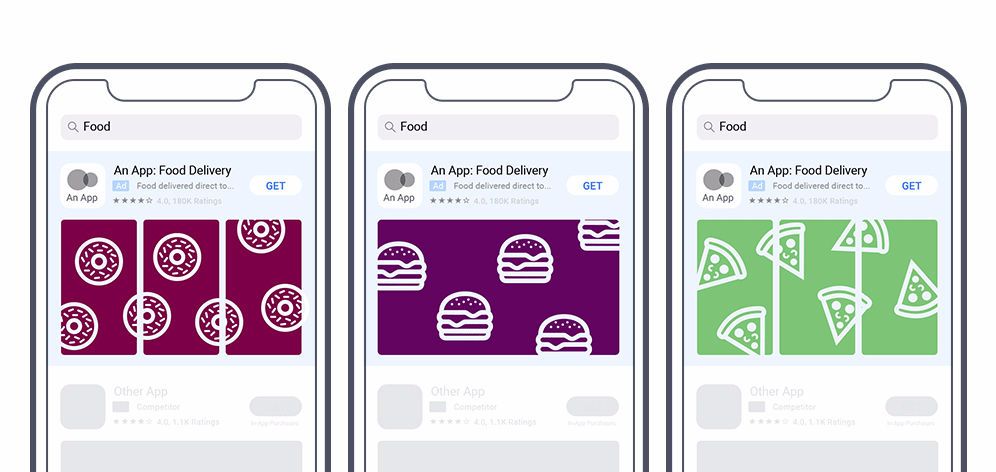
Search Ads Creative Sets
Visually optimizing your App Store ads is important when it comes to grabbing visitors’ attention in search results. Last May, Apple launched Search Ads Creative Testing to allow testing of different screenshot and app previews combinations. Visitors can, for instance, be shown screenshots refined to their demographic or location, and performance of the ad/campaign can be measured in the Search Ads Console.
Creative Sets are technically not an A/B testing tool (as available in the Google Play Console for instance), however, they can be used for a similar purpose. When set in an ad group as unbiased as possible, these tests can generate learnings applicable to your App Store page to increase your organic search and store page conversion rates. Phiture has written an article on setting up Creative Testing explaining the topic more in-depth.
There are a couple of challenges with running Creative Sets
- Statistical significance, conversion rate and relative uplift of a variant are not displayed in the Apple Search Ads console and need to be computed manually.
- Also, although only visual assets already uploaded to the App Store listing can be tested, these are not displayed conveniently in the Search Ads console.
To simplify this process and make Creative Testing more efficient, Phiture has built a Creative Set Results Calculator which we based on this A/B testing calculator by VWO. This tool can also help with keeping track of your tests.
Steps for using the Creative Sets Results Calculator:
- Before you start using the calculator, make sure you copy it to your own Google Drive.
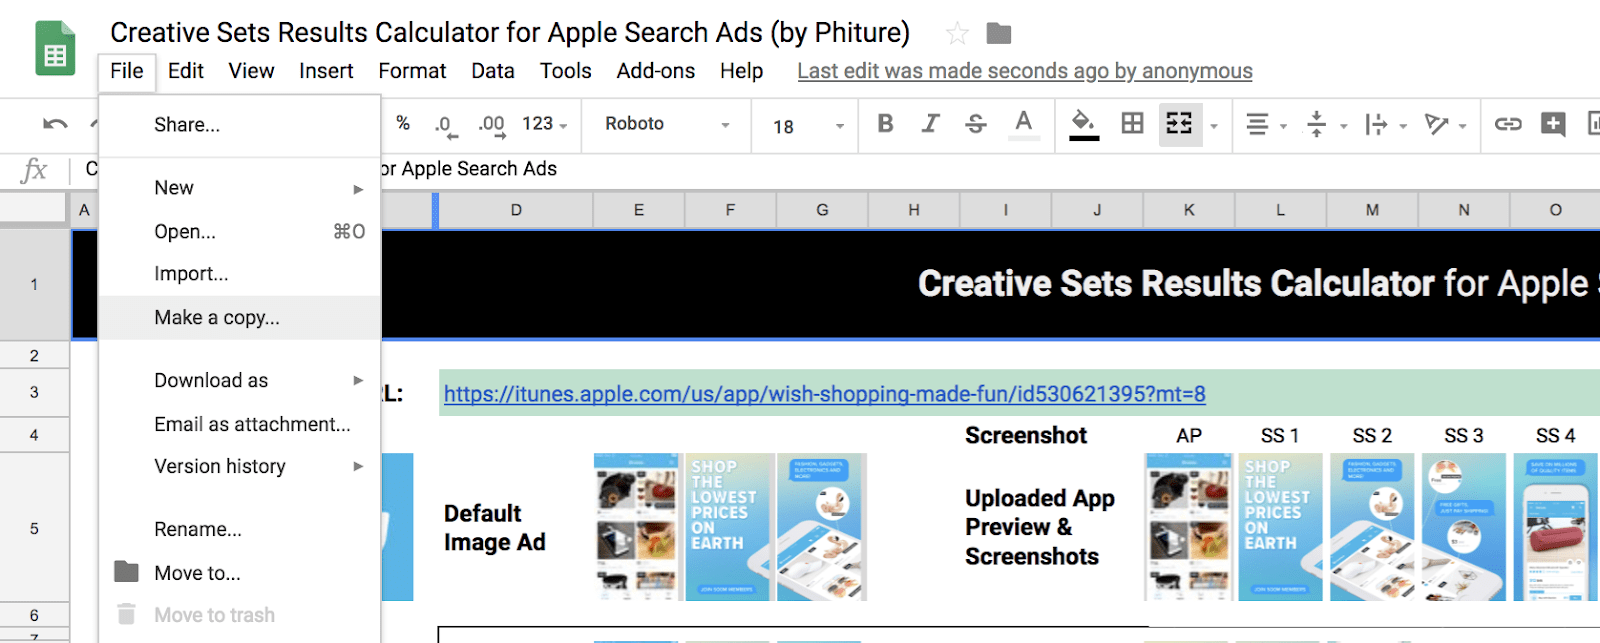
Make a copy
- Paste in your iTunes ID or URL at the top and choose the country where you run search ads from the drop-down to the right.
App previews and screenshots will now be automatically pulled from the App Store listing and all assets uploaded there can be seen in the first row.
- Pick the app previews and/or screenshots for each combination of screenshots and app previews which you would like to test.

Pick the app previews and/or screenshots
You can run up to 10 Creative Sets per ad group on the App Store. While most of the calculators out there only analyze results one by one (e.g. default against one variant), with this one, you can analyze the results of up to four variants.
- Log in to your Apple Search Ads account and click on the relevant Ad Group where you have been testing different combinations of visuals. Go to the Creative Sets tab to see impression and conversion data.
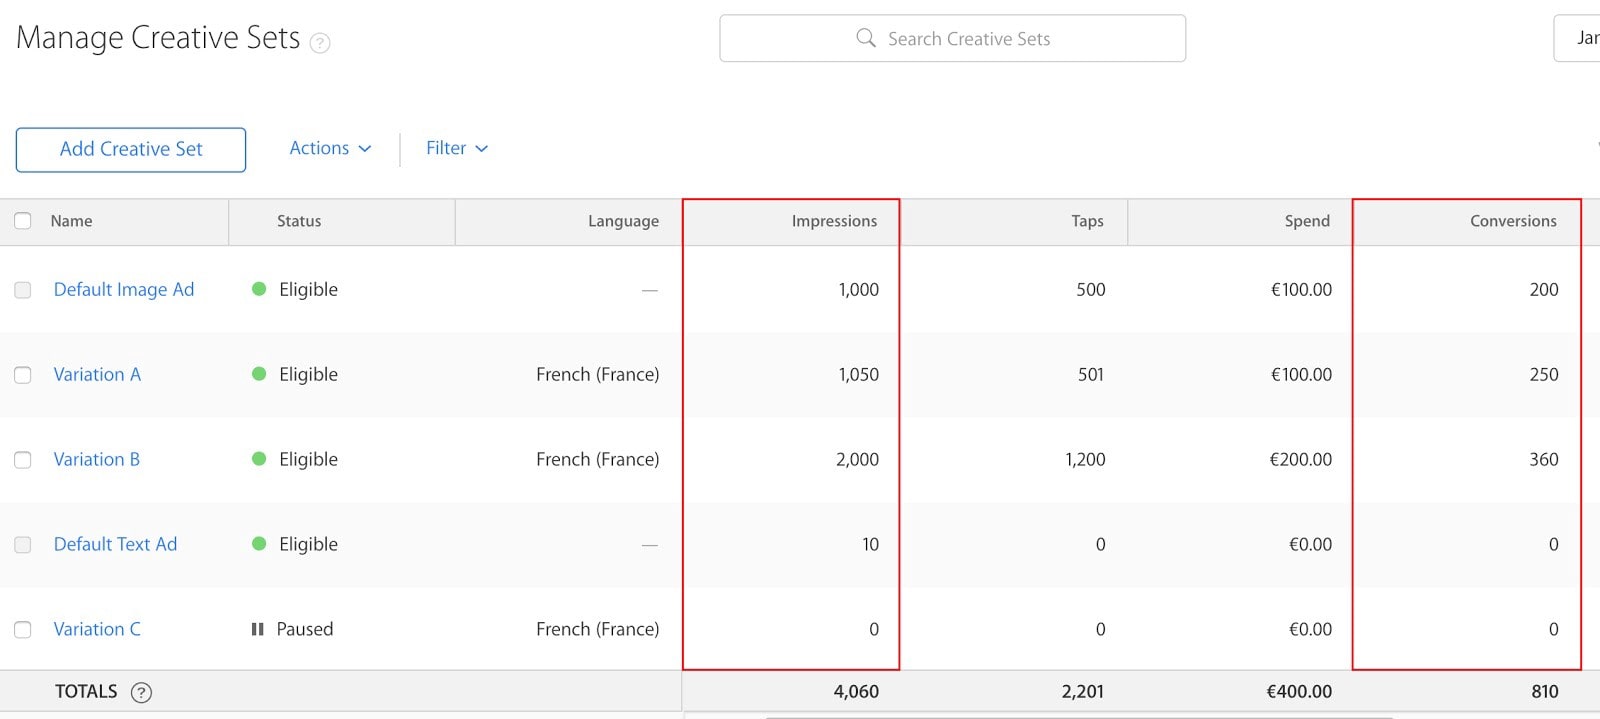
Get data from Apple Search Ads
Simply looking at these two metrics will not give you many insights into the performance of the assets. Apple does not provide with the key metric — the impression to conversions ratio, so our first step is to calculate this ourselves: 
- For each Creative Set, data on impressions and conversions should be added to the respective section in the calculator, to compute the conversion rate. You should set the confidence level according to your preference.

The calculator will show the conversion rate comparison between the default image ad and the variants which has the highest conversion rate in a statistical significance test, or has a comparable but lower conversion rate in statistical significance test.

Test results
Any results not reaching the confidence level will not be shown.
Not only does the result show how well each Creative Set converts visitors but also which variation performs best. The calculator will automatically display the screenshots of the winning variation and the relative uplift of the winning variant. That is, the conversion rate uplift of the winning variant compared to the Default Image Ad.
Statistical Significance
Can we conclude with enough confidence that we have a winner here when we see a conversion rate uplift or might this just be due to chance? Not really. That’s why the calculator also addresses the confidence level of the uplift, stating how sure you are that this uplift is true. For instance, the result in the image above shows that the Creative Set Variation A performed 7.1% better than the default image ad with a 78.77% confidence level. It means that you are 78.77% sure about the 7.1% CVR uplift brought by Variation A is true. Typically companies use either a 90% confidence interval as their desired confidence interval, more risk-averse companies need to have at least 95% confidence in that they can trust that there is an uplift.
Also, bear in mind that this is not a true A/B test in that Apple is not randomly dividing the traffic, and the % of impressions that will be sent to the creative sets will change over time.
Big shoutout to Luca Giacomel for providing the recommendations on the adjustment over the multiple comparisons, which makes that results of the calculator more reliable than most of the A/B test calculators when it comes to multivariate experiments.
Alright, now over to you. Here’s the Creative Sets Results Calculator for Apple Search Ads. Make a copy to your own Google Drive and play around it. We are looking forward to reading your thoughts in the comments!


