It’s rare to find a marketer these days who doesn’t talk about A/B testing in some shape or form. As simple and straightforward as it may seem, A/B testing can be a polarizing subject. Seen as the gold standard of validating a process, the whole process nonetheless creates so much confusion around how to interpret the results that they often paralyze teams completely.
To make the most out of our marketing efforts, we rely on data from A/B tests to make sure we’re making informed decisions on how to improve our acquisition, retention, product engagement, and more—but it’s not always easy to do so.
A/B testing addresses a lot of the key questions that can inform the core strategy of your app. Additionally, it can also act as a tool of humility—especially when we start seeing how wrong we can be sometimes about understanding our users’ needs.
In this article, I hope to address some of the key challenges that teams face while using A/B testing as a tool to inform and assist the core strategic goals of your business. This article also provides a watershed A/B Testing Framework designed to help set-up your team’s testing efforts to maximize learnings and contribute towards the metrics you care about.
Before we jump into the essentials of a testing process, it’s important to first understand where you stand in the different levels of testing prowess as a team.
Levels of Experimentation Prowess
At Phiture, we often see teams—both small and large, from companies of varying sizes—using one-off testing instead of running an experimentation program. These teams struggle with building methodical experimentation processes and instead resort to testing small optimizations to efforts they’ve already put in. For instance, CRM teams often resort to testing subject lines, CTAs, and copy, on status quo campaigns only. Although the intention here is in the right place, there isn’t a solid set of learnings the teams can then gather from such random experimental data points.
If we plot our teams on testing complexity and testing frequency, they fall under one of the following levels of experimentation prowess:
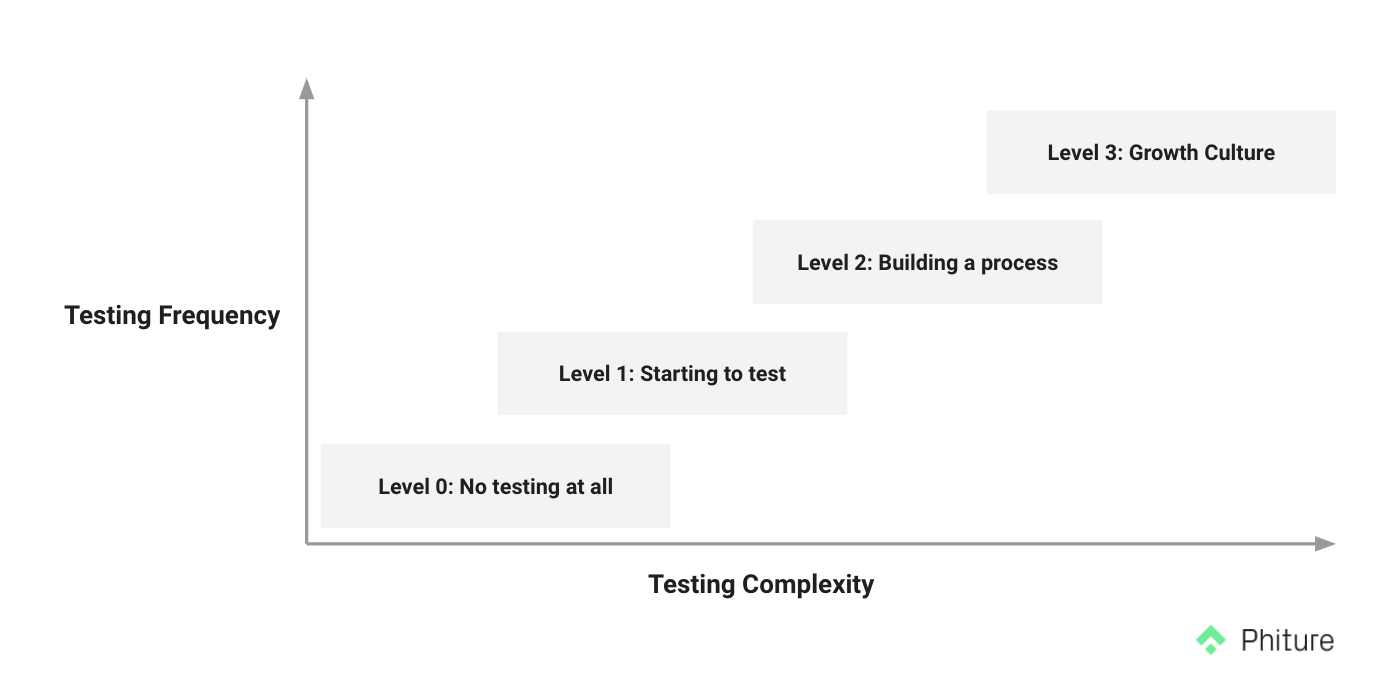
- Level 0 represents companies who might have just started their CRM program or are still getting the team in place to deliver results but are not able to test at all.
- Level 1 comprises companies that now have the right setup in place and are running disconnected tests (in this case, the hypothesis might be good individually, but the ideas might not be related to the learnings).
- Level 2 comprises teams who are on their way to building a process that is adopted by all relevant stakeholders. This step is one of the most crucial, but least adopted, because it requires coordination between teams that are often siloed. However, Level 2 is most likely the most crucial step to overall company success. Adopting these processes allows for mutual understanding of initiatives and goals during your tests.
- Level 3 comprises industry leaders when it comes to experimentation. That includes companies such as Facebook, Google, Hubspot, and Netflix. These companies usually involve having harmony between several flows, which, in turn, comes down to really building a culture of growth in the company.
Over 70% of the teams we surveyed, most find themselves at Level 1 and Level 2. Indeed, most teams are starting to test, and/or struggling to build a process around experimentation. This truth reflects the fact that many product managers, marketers, and engineers think they know how to run an experimentation program when in reality, they don’t. Instead, what they actually know how to run are tests—actions that generate an output. The difference I’d like to point out is that experimentation, however, is a broad, repeatable system that happens to include testing as one of its steps.
Setting up and maintaining the right processes is often tough. It involves a lot of upfront groundwork, management of a lot of stakeholders, and forcing everyone to work out ideas in a bit more detail than they’re used to. All this effort is worth it, however. Take Duolingo, for instance: they have hundreds of experiments running at any given time, and by constantly learning and improving from these tests, they’ve managed to increase their Day 1 retention by 4.2x (from 13% to 55%). Though rare in the industry, Duolingo’s results are a firm reminder of the way that a thoroughly-planned experimentation program yields results.
The A/B Testing Framework
After having worked with several teams facing these challenges, we at Phiture have developed a framework that can help us cross the hurdle and overcome those challenges. This framework is a step-by-step process to building a scalable experimentation process and has been built and adapted across a variety of different verticals.
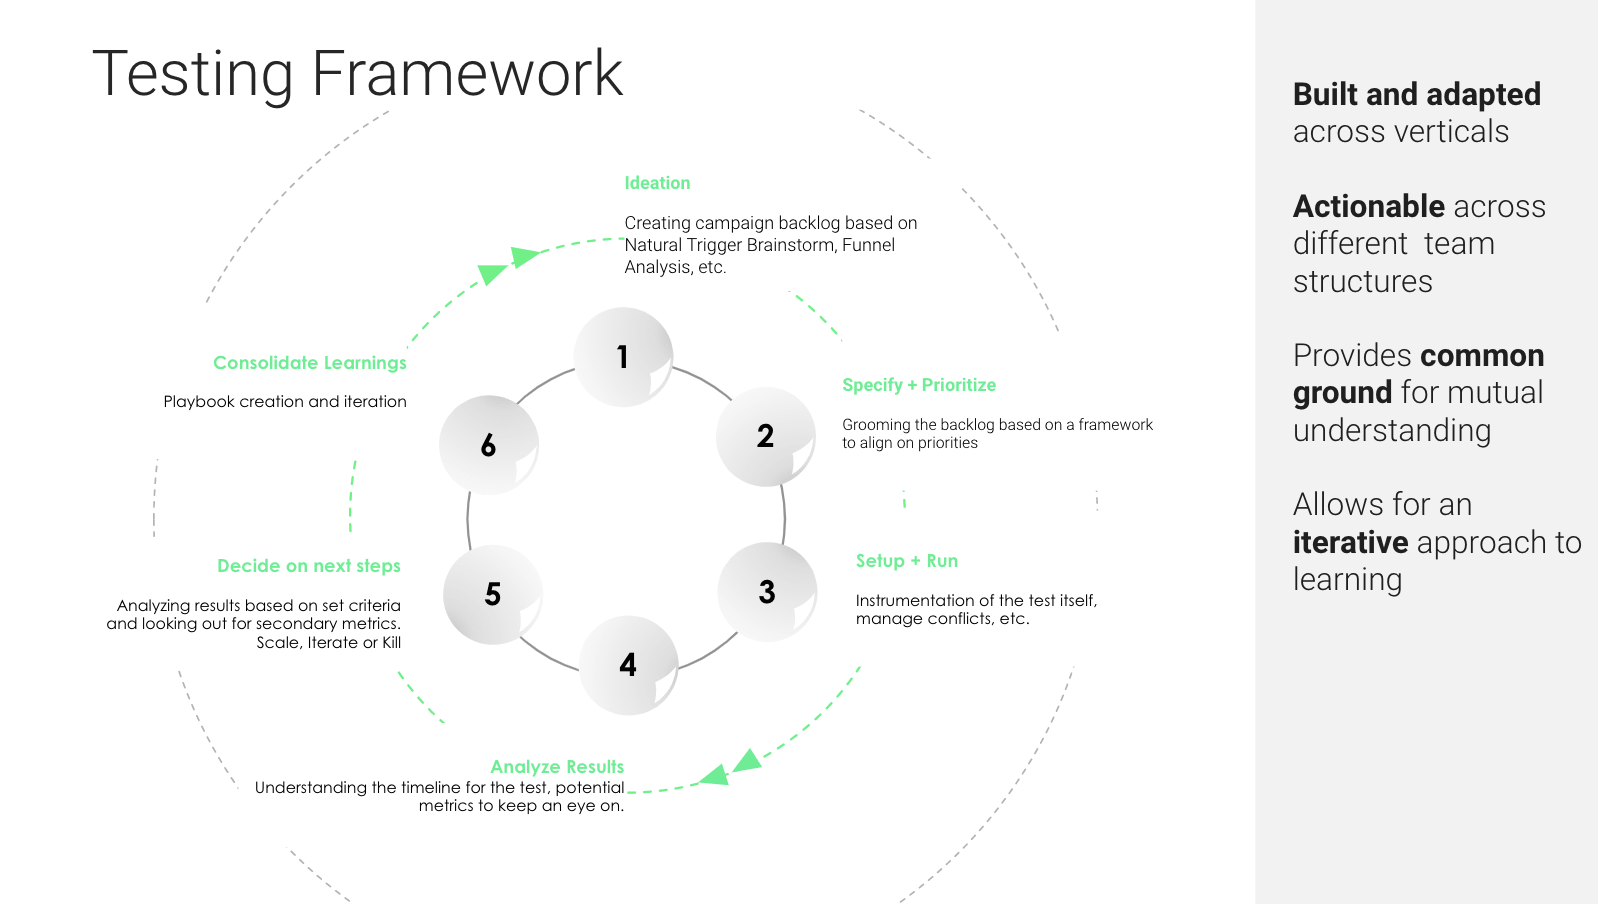
There are three key goals to the A/B Testing Framework:
- To communicate ideas from all teams and prioritize based on company objectives.
- To understand and define core metrics—whether they’re leading or lagging metrics.
- To centralize test results and communicate the next steps.
In order to maximize the framework from a strictly executional point of view, it’s important to have the following three output documents:
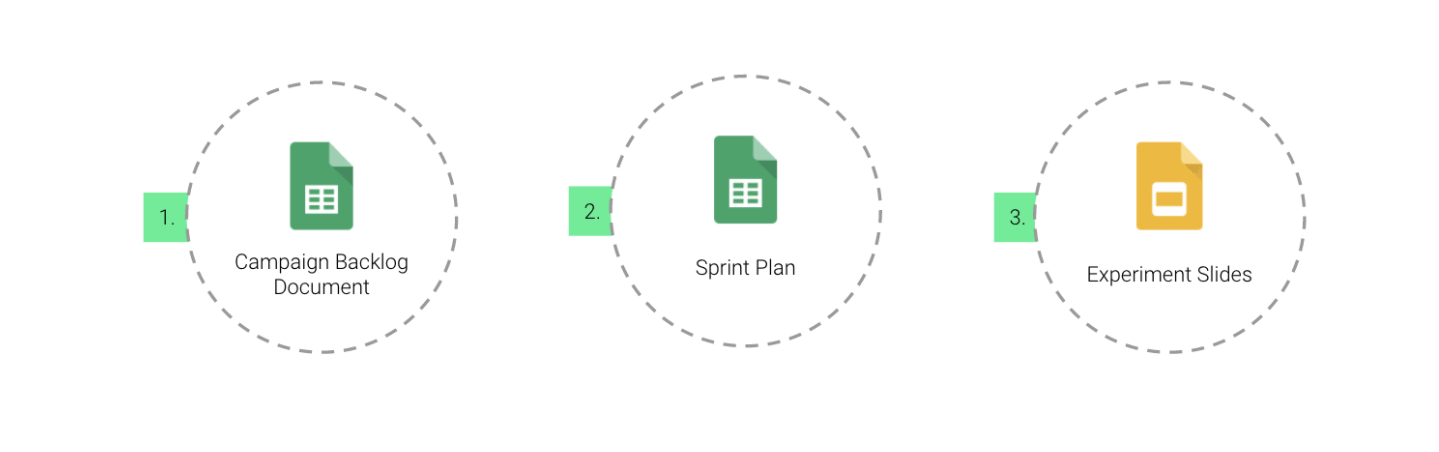
Your campaign backlog document captures the ideas that have been generated throughout the process, a place where you can also work them out in detail. A sprint plan will help you see if you’re in line with your business objectives and what you tested with different frequencies (weekly, monthly, yearly). Lastly, experiment slides show your experiments and ideation process in a visual manner, which will ensure buy-in from other team members.
Now, let’s go through each step and discuss what it could look like in a strictly practical sense of implementation for your team.
1. Ideation
Three main buckets comprise the ideation phase. The first is your quantitative data. Understanding what happens within your app—user engagement, feature adoption, onboarding funnel—is critical to creating hypotheses to fix any drop-offs or lack of engagement.
The same goes for number two: qualitative data. You always want to talk to your customers to understand their pain points. You’ll be able to see any commonalities as to why users are getting in touch with your company through user surveys and customer care. Important here is to remember to focus on the good parts of user behavior. That will enable you to orient users to certain actions that destroy their bad perception of the app.
Lastly—and this is my favorite tool—is brainstorming. Brainstorming involves starting with an assumption or observation: you start asking “why” in layers until you reach a hypothesis that can be the basis of testing. There are many brainstorming techniques, including natural trigger brainstorming or driver trees, but the important part is to get your team together and ideate together so that everyone has the right buy-in.
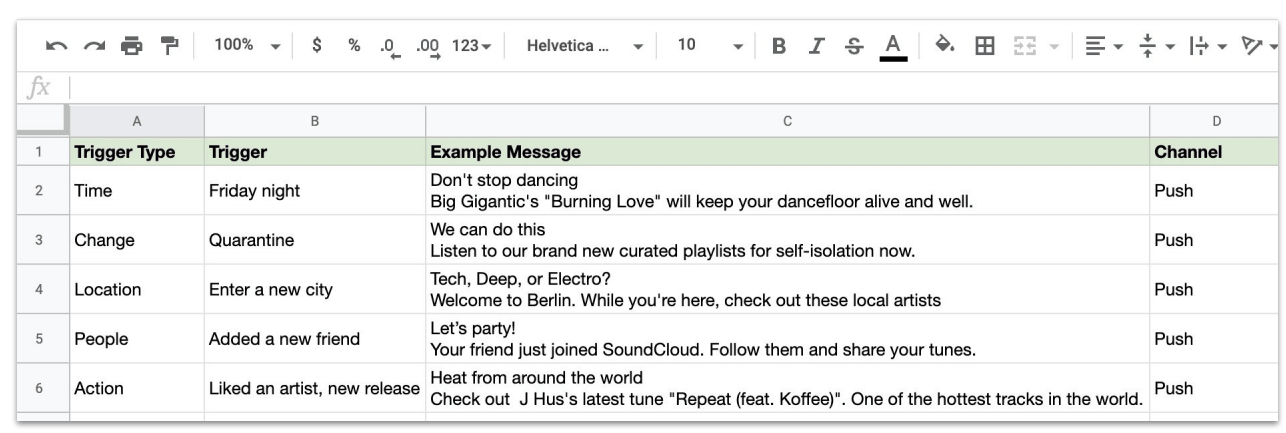
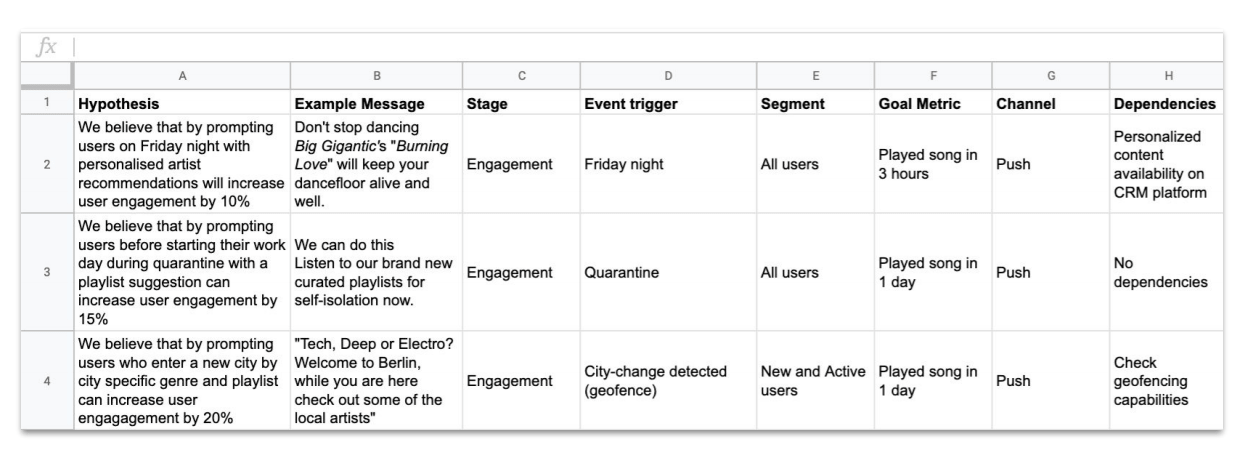
A campaign backlog filled with several initial ideas from the ideation session. The example is based on a SoundCloud use-case.
As previously discussed, your ideation phase should also have a campaign backlog that stems from your brainstorming. If you don’t, you won’t be able to evaluate what to test, and your learnings will be limited. Having cool ideas is one of the best parts of our jobs—but the make or break situation comes when you start evaluating for impact.
2. Specify and Prioritize
After your ideation phase, you then need to specify and prioritize all of the blue-sky ideas you discussed earlier on. Start by taking your insights and translating them into hypotheses. Then, create a few example messages that stem from your hypotheses, identify what stage the user is in (engagement, activation), and decide how you want to measure your results (your key metrics) (see the chart below.)
Hypotheses, example messages, stages, segments, metrics, and more—your specification and prioritization phase should look something like this.
After that, it’s time to look at your own capacity. You may have cool ideas, but if your product team or tech team just doesn’t have the time to work on your hypotheses, then your ideas will be dead on arrival. That’s why it’s important, in this phase, to identify dependencies and event triggers (time that an event happens).
With all of your hypotheses, however, what’s the best way to prioritize your ideas? At Phiture, we use the RRF Framework: Impact = Reach x Relevance x Frequency. Measuring how many users are reached, how relevant it is for those users, and how often a user might get exposed to these tests hits all the variables of effective A/B experimentation. Once you know that, evaluate your hypotheses by assigning them numbers in order of difficulty per category (see example below).
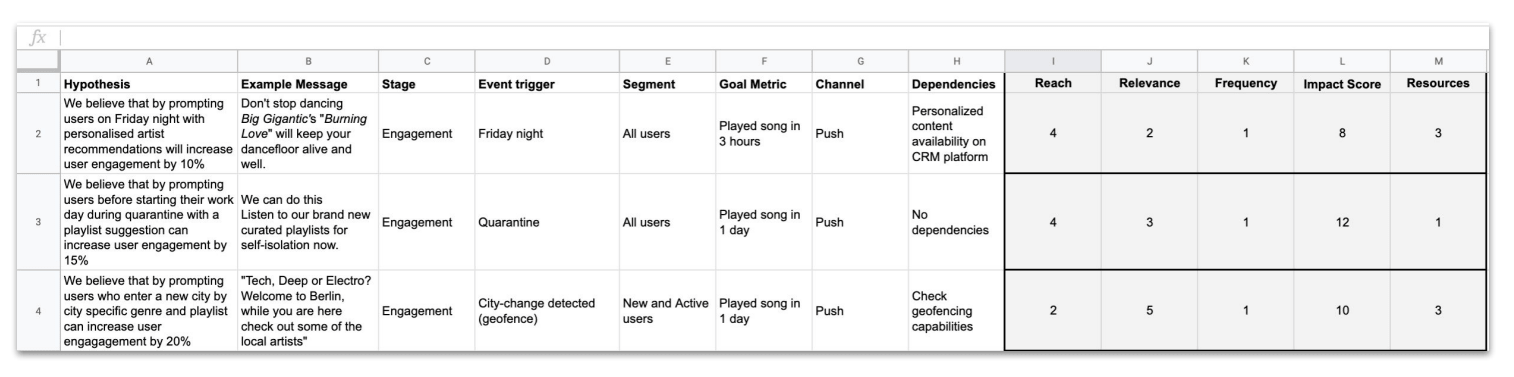
Evaluation of all the variables by category
Tackle the ones that require fewer resources, are easy to implement, and have a high impact.
3. Setup and Run
There are three essential variables to consider here. The first is measurement when you set up your test. What is the test split for the test? How long will the test have to run before we get statistical significance? How is your campaign set up? Do you have the global control groups in place? Answering these questions in the nascent stages helps your test run smoothly. You want to be able to measure not only how your campaign is performing against your B variable—you want to see how your team is performing, i.e. the incremental value that your team is bringing to the table. That’s done by having a master control group, or a hold-out group.
For “big picture ideas,” and especially if you’re just starting out with the process, I recommend starting out with a 50/50% split to see results cleanly and clearly. It’s the best way to measure which ideas are the most effective, giving you the clearest directional indication of what is working. A caveat: this number largely depends on how big your user base is. For instance, if you have an app with a few users who will be exposed to the experiment, you may wish to value speed over certainty and go with a higher test split (see picture below).
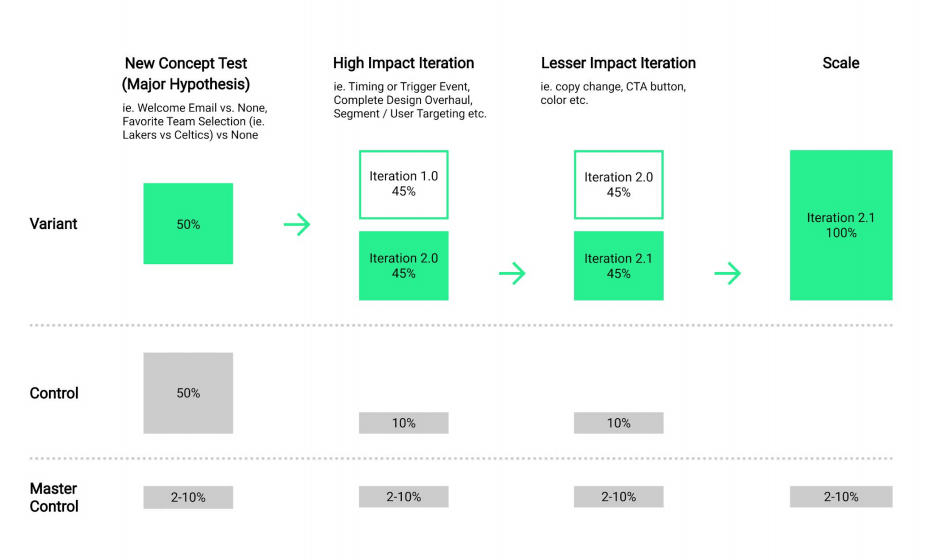
Campaign level and master control groups.
Secondly, although many teams run valid experiments, it’s important to keep a few things in mind. Before running an experiment, calculate that the targeting has sufficient size to get a valid result in a reasonable timeframe. It’s best to run campaigns over a minimum of 7 days to average out the day of week variations. Sufficient audience sizes are required to have statistical confidence in tests.
Planning ahead is crucial to setting up a successful experiment. Take the following example: say we want to estimate our sample size for a potential test. And say we want to detect a 10% increase from a base conversion rate of 2% with 95% significance, and we want to estimate our sample size. Each group should be at least 90,000 per variant. In other words, if you’re going to get 10,000 users per day, the test will have to run nine days (see example below). Using the right tools to calculate the bassline conversion rate, minimum detectable effect, and statistical significance ahead of time will make your experimentation yield quantifiable results.
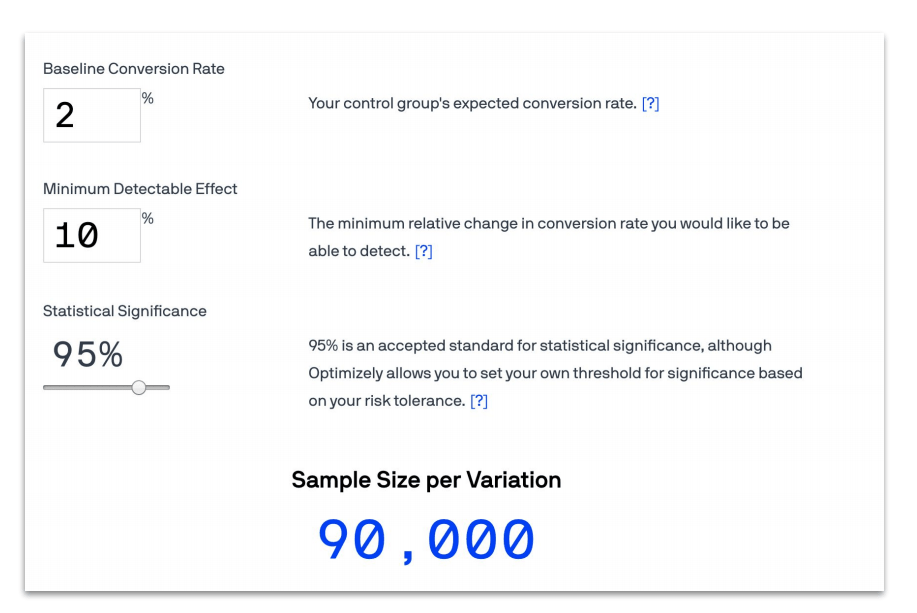
Example from Optimizely. All three variables here are important to create the perfect mix for an effective A/B Test.
4. Analyze Your Results
With step four, remember to always know your leading indicator and core metrics. Leading and indicator metrics, such as subscription purchases, app opens, or outbound calls, are often measured with tools such as Braze, Leanplum, or CleverTap. These metrics are directly influenced by your campaign.
The combination of these metrics also feeds into your core metrics, which often include W1/M1 retention, revenue, and the number of power users—often measured with tools such as Amplitude or Mixpanel.
5. Decide On The Next Steps
Once you’re through analyzing your results based on set criteria, looking out for secondary metrics as you go, it’s time to decide on the next steps. At this stage, a lot of teams start having a classic “win or lose” mentality: they see a successful test and they just leave it out to dry. But in reality, there’s a lot of scope within a particularly successful test to optimize and iterate on it over and over again. A significant positive impact means that you should scale it, and continue to build on it.
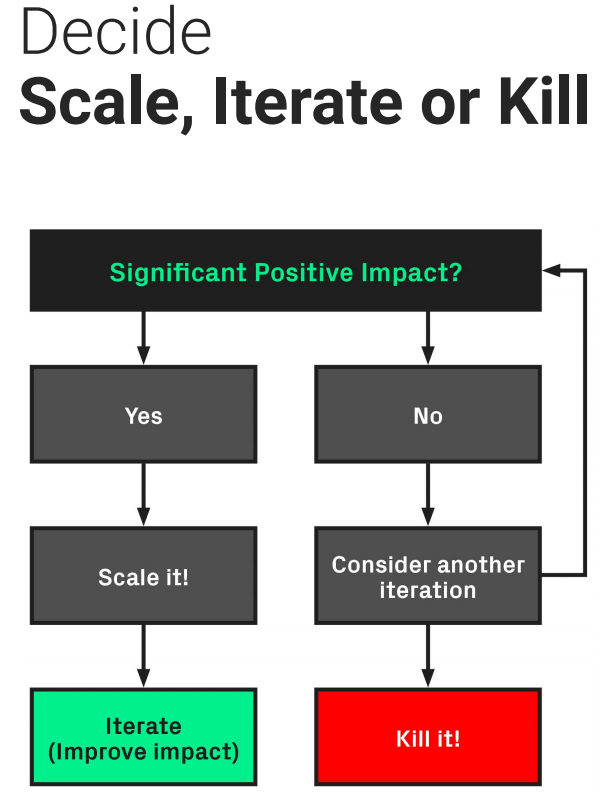
The scale, iterate or kill flowchart for A/B testing
If your test didn’t show any significant positive impacts, but if you felt that you had a good hypothesis in place—or you had some great ideas in the ideation phase—then it’s worth considering iterating on it again before you kill it. I don’t recommend doing this more than two to three times; more often than not, we get very attached to our ideas, and have trouble letting them go. After two or three unsuccessful experiments, kill the test and start with a new one (see above).
6. Consolidate Your Learnings
This step is often the most manual part of the framework, but it’s the most vital. Showing what you’ve worked on foments buy-in from different teams, and also creates value as a source of truth for your organization. This step enables team members to see the progression of your hypothesis, your actual results, and your ultimate learnings—not to mention the impact of the whole test.
At Phiture, we use a particular template to record campaign results (see below). We note down the experiment ideas, mention the initial hypothesis, and show what the results look like. Most importantly, we also have a “validated learning” section at the bottom. Using a template allows your A/B test to become more visual and conclusive, an easy way for other teams to dive into what you’ve been doing.
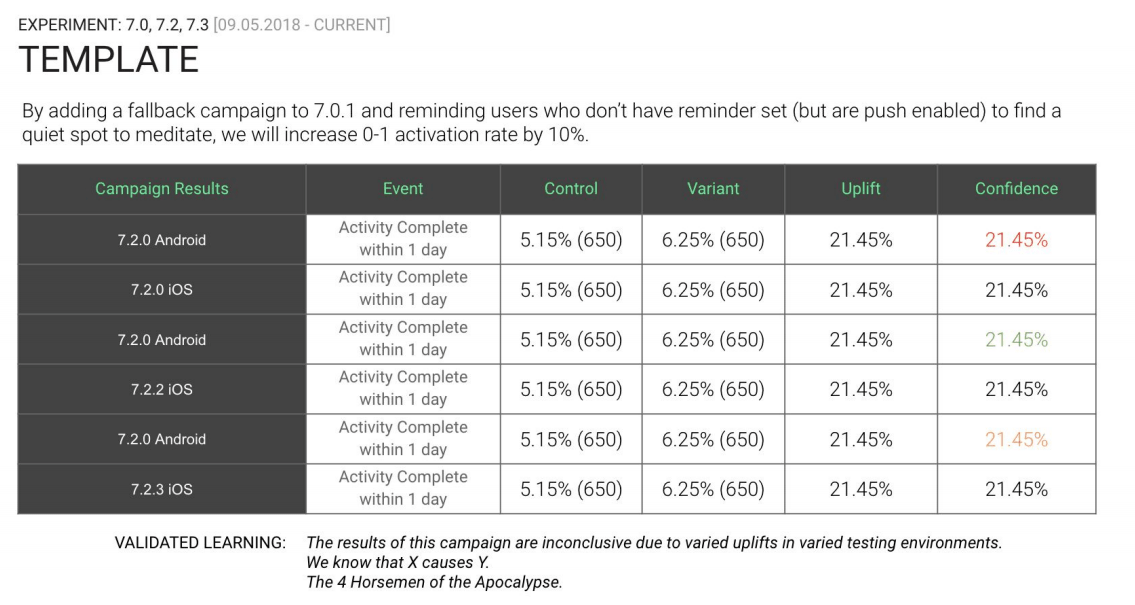
The Phiture template for consolidating results and learnings
Last but not least, this framework is cyclical. Consolidating your learnings will always feed into the next ideation phase. As you begin to circle back, these steps will become easier and easier, as your teams begin to reconcile each step to their own work pipeline. Followed correctly, this framework can unlock some tremendous opportunities for your team and your organization.