At Shapr3D, we’re creating the world’s first mobile CAD designed specifically for iPad Pro. When Shapr3D released the first promo video, it reached 4.5M views in just a few weeks. The video went viral. The app was still buggy, had many issues, but the hype and demand seemed to be there.
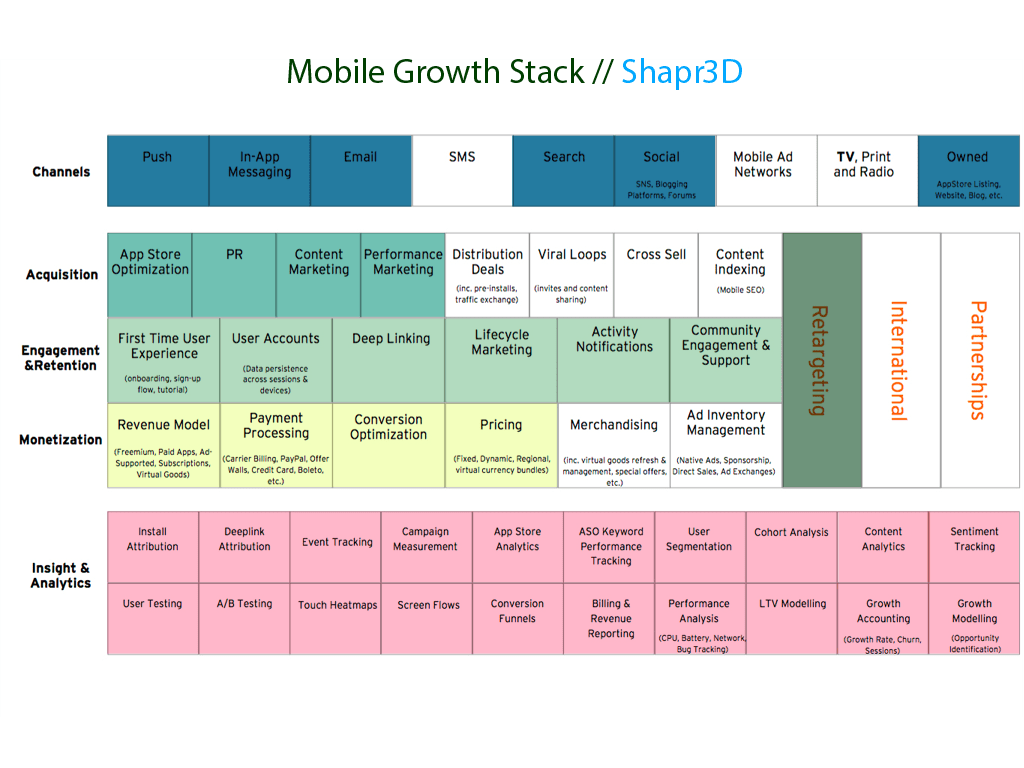
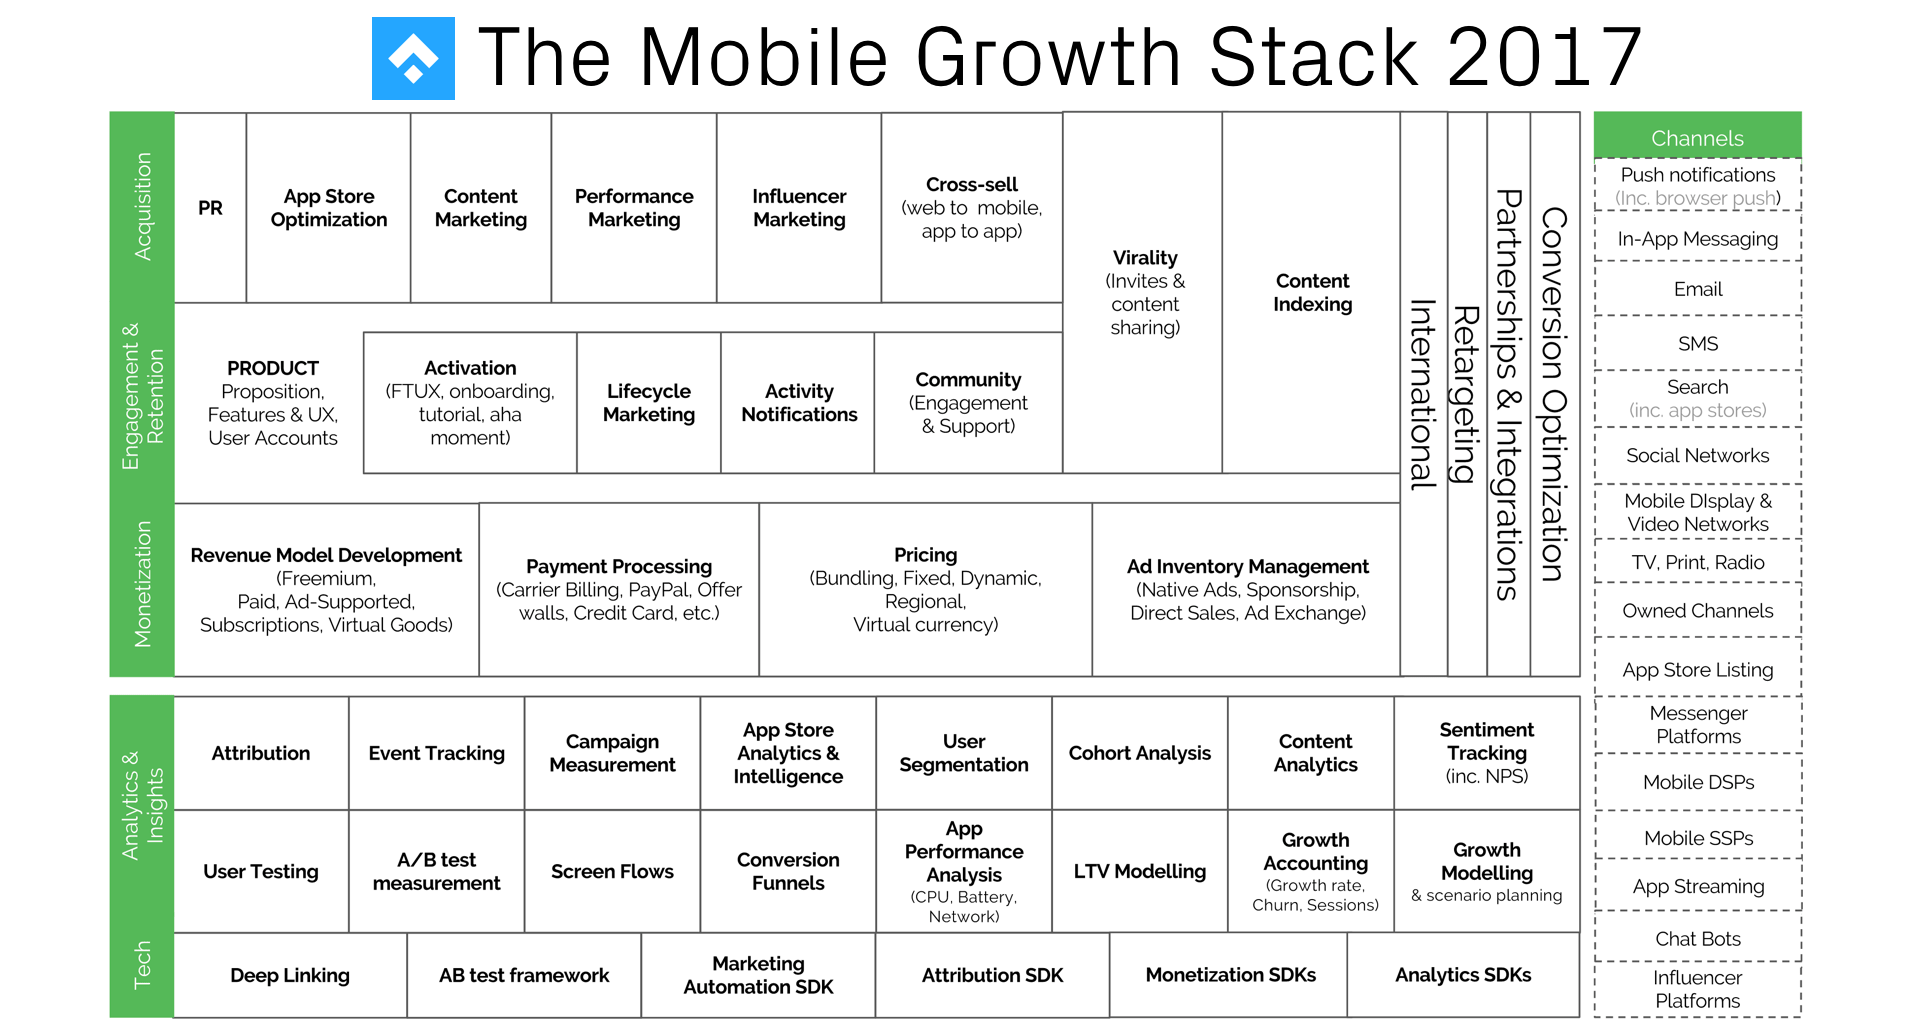
This is was the time when I joined the company, as the 3rd team member. My job was to drive app installs plus grow the retained and monetized userbase. To organize my thinking I used the Mobile Growth Stack framework (which I had come across a few months earlier).
But before applying the framework, I needed a deeper understanding of how the product works and how users interact with it. So had to set the framework aside for a few days and refocused on the user journey.
Visualizing the user journey
During the first few days, I quickly drew a basic funnel that represented what users were doing in the app and how we can identify elements to grow.
To visualize this I structured the funnel alongside Dave McClure’s AARRR funnel, added initial metrics to track and the basic interaction I thought were important that time.
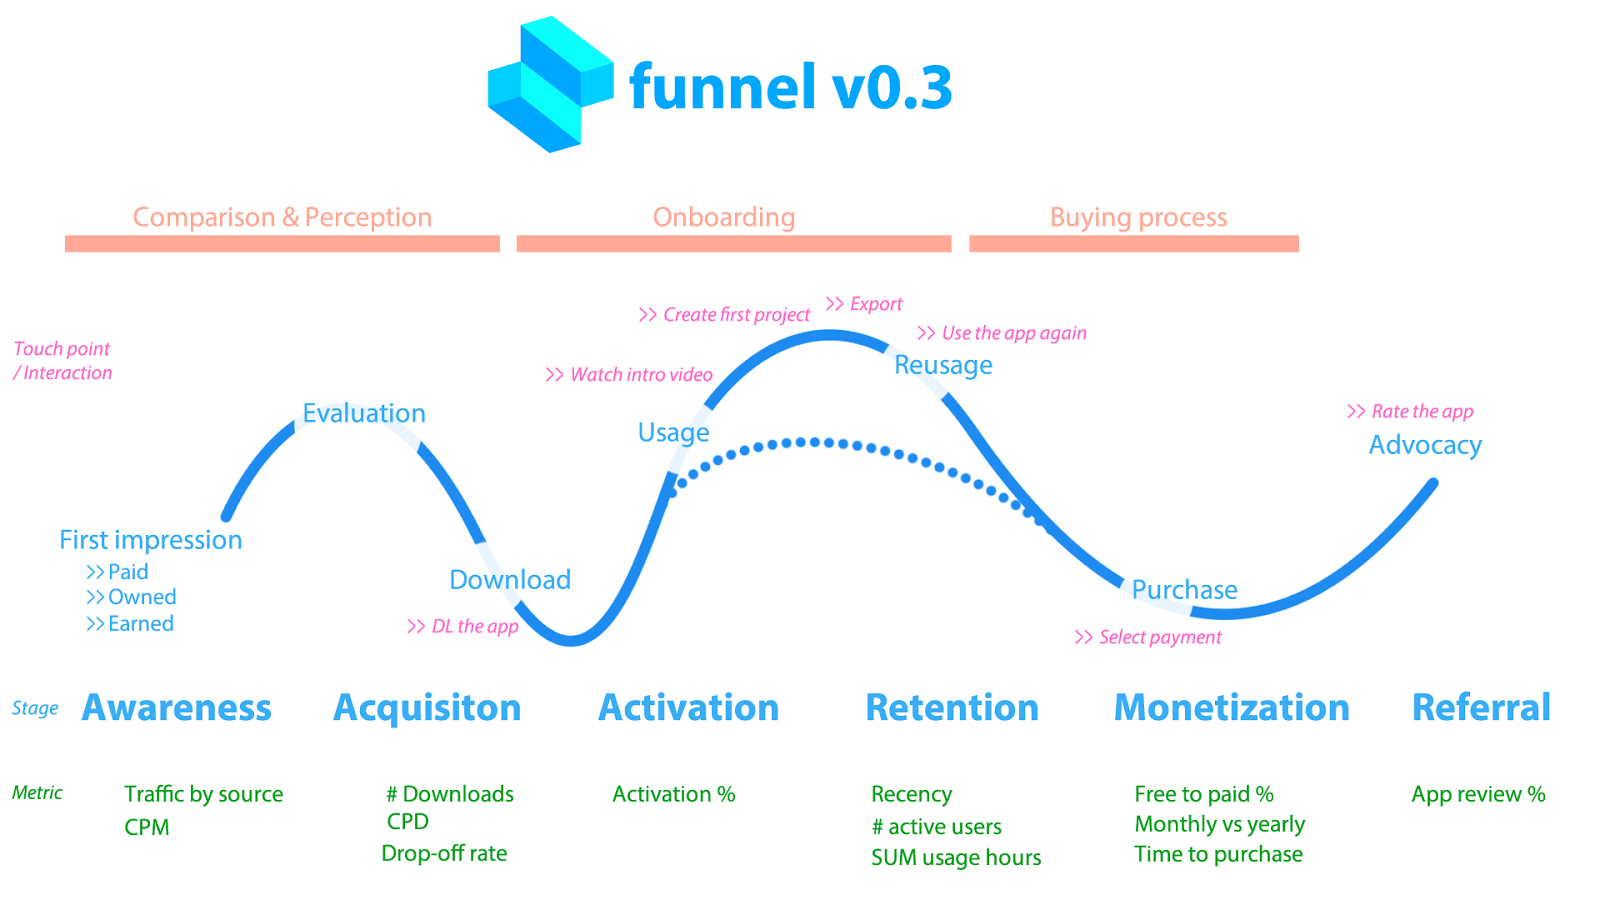
I recorded certain metrics (in a GDPR compliant way) that I had data about for all stages. For Awareness there was traffic by source and CPM (cost per mille for Facebook ads), For Retention there was Recency (how recently they used the product), the # active users (weekly + monthly) and the SUM of usage hours (weekly + monthly, and so on.
These were very important baseline metrics I need to know because we would try to influence these with the work.
Once I had this mapped out and collected all the data in a few days, it was time to plan the next 3–6 months of work.
Identifying strengths and weaknesses
It was pretty evident in the beginning that I had way more questions than answers. When I was trying to figure out certain things (free to paid conversion, time to purchase etc) it turned out that our data infrastructure didn’t track these things. We had many questions, but there was no data to answer them.
So here’s what we did:
- Wrote down all the questions we had
- Wrote down all the metrics we wanted to track
- Figured out how to collect that data
- Implemented that data collection
- Tested if the data was reliable and accurate
It took us close to 3 months to create the right data infrastructure inside Mixpanel and Firebase. It’s interesting to see that most articles covering growth, mobile growth and growth hacking usually skip this data + infrastructure part. Without this layer, a startup is just running around like a headless chicken.
Without good data, it’s nearly impossible to make good decisions.
So all the time and effort spent on this project was worth the time investment. It was time to pick up the Mobile Growth Stack and put it to good use.
How we use the framework
I decided to do little experiments and see what “boxes” I was using along the way. One day I was creating a Facebook ad for a specific target audience and colored all the boxes that were in play.
So let’s say: I run a FB ad campaign to drive app installs. I want to know what the CPD (Cost per Download) is.
From Channels I use Social (Facebook), in Acquisition, I select Performance Marketing (PPC) and I want to track and measure the Campaign in the Insights & Analytics layer.
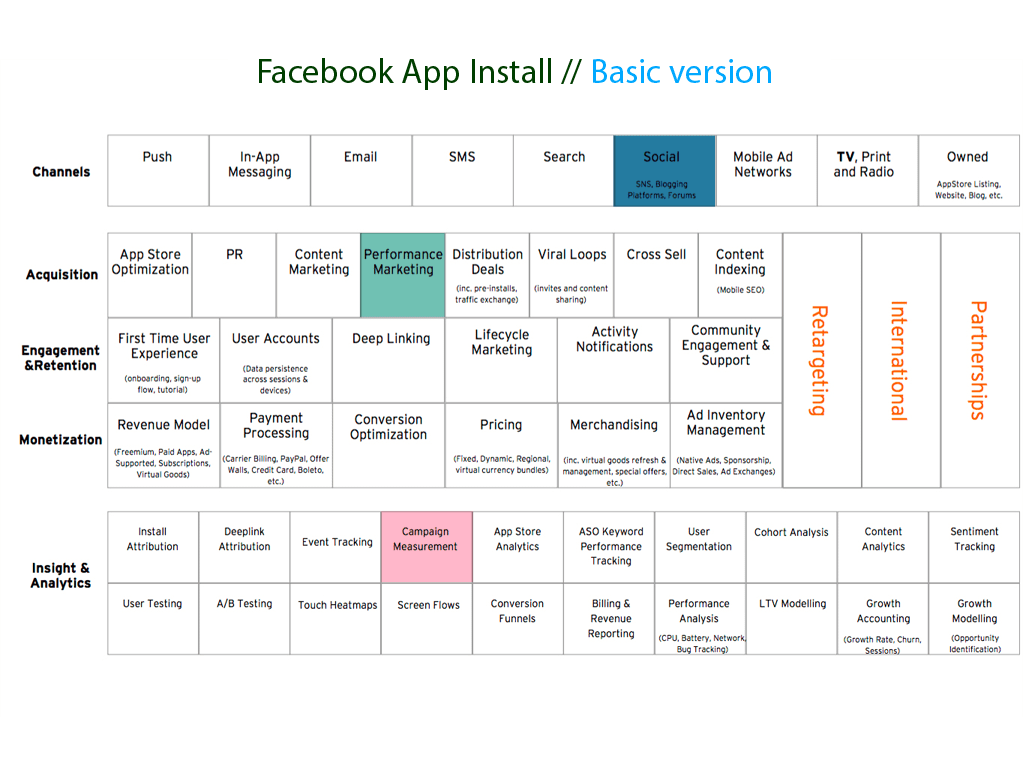
Note: This is the 2016 version of the framework that I used. You can find the most-up-to-date, 2017 version here.
For the ad, I use Facebook’s PowerEditor and I can track all the data in there. Three layers, three boxes and one tool. Sounds pretty evident.
But what happens if I have a lot of questions and want to track more variables? A few things that came into mind right away:
- What happens when I run an A/B test?
- What if I run an A/B test at different times / for different cohorts?
- How can I calculate ROI on this ad?
- What will be the free to paid conversion rate on these users?
And the list goes on. To get a better picture of what was happening along the way I need to use more elements from the growth stack. To run an A/B test for different cohorts and see the results I needed to use internal Mixpanel data. To calculate ROI I had to use iTunes Connect Analytics and some sort of deeplinking solution like Branch. As I was expanding with my questions and tools, the stack became a little more crowded. Just see the image below.
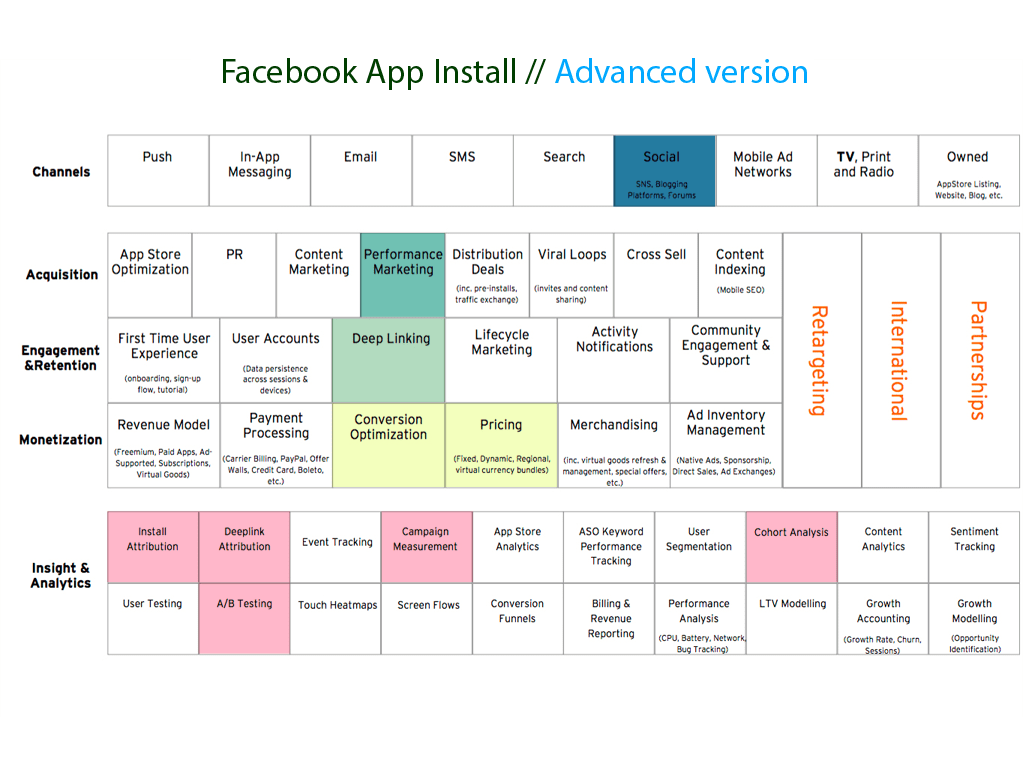
The campaign: do a Facebook app install ad in June and July for 3–4 different target audiences and understand how each message + copy converts. Not only to app downloads but to paying users.
For Channel, I was still using Social (Facebook), from Acquisition Performance Marketing (PPC app install). To know who comes back from these users I was using a tagged link using Branch. I was trying to figure out what the download conversions and also what free-to-paid conversions were. In Insight & Analytics, I had to use Install Attribution to separate this campaign from other campaigns, Deeplink Attribution, Campaign Measurement, Cohort Analysis and A/B testing.
I could have used more here, but these were enough all ready to experiment with.
So after understanding what I need to track, here’s what I did:
- Created 3 app install campaigns in PowerEditor
- Used a separate deeplink for each of these (tool: Branch + iTunes Connect campaign manager)
- Then used Mixpanel data to figure out who converted and who did not
To have this conversion data, I also needed to know the average time-to-purchase data as well. Because if it takes 2–3 weeks for people on average to convert from free to a paid user, than I can only calculate ROI if a certain time passes where users are likely to be converted from that campaign. To calculate this, you can dig deep into your internal / Mixpanel data or write a JQL query to pull it out quickly.
OK, now you see, this is where things become interesting. We only ran a split Facebook ad in two different time windows and the 3 boxes and 1 tool combo quickly jumped to 10 boxes and 5–6 tools.
And yes, we could also add more tools and boxes but that itself is not the goal.
You don’t want to overcomplicate things. You just want to take one small step and include one new element as you progress.
Currently, these are all the boxes that we use at Shapr3D. Currently, we are a team of 7 (2 doing marketing), so it means one person has to handle many layers, boxes, and tools at the same time. But as we scale, we can start to separate these and assign to specific people or even hire for certain roles/tools.
Data quality: word of caution
Just using the framework won’t necessarily solve all the growth problems. And just by collecting data is not enough. You should always try to understand how that data is collected and how reliable is it. When I was running data driven tests back in October 2016 to drive paid app installs I realized that different tools (Facebook, Branch and iTunes Connect to be specific) gave me different results for the very same metric (“app installs”). And the numbers were really off.
I was doing Facebook ads and tried to track attributed installs with the iTunes Connect Campaign Generator and Branch combined. In an ideal scenario, those install numbers should have been the same, or very close to each other. Branch and Facebook reported about the same numbers. But iTunes Connect was off by 50–70%. Ouch.
Here are some real numbers from those campaigns.

I realized that I had to double-check every campaign that was involving iTunes Connect because the data quality there was not 100% reliable. Wrote about the exact use case more extensively and why data literacy matters on a data blog here: https://data36.com/why-data-literacy-matters/.
The benefits of the framework
Printing out the framework and coloring it really helped us focus.
I have the growth stack printed and posted on the wall in our office just above my desk. So whenever I get confused and look up, I see it. Then hopefully things become a little more clear.
Just recently I also started to create little playbooks for each marketing activity and have a colored framework attached to it. So when I need to run a new campaign I instantly see what layers and boxes I have to utilize to get the most out of that campaign.
When we read blog posts on Medium or somewhere else about how others have “growth hacked their way”, we always put down that idea in a spreadsheet, and during the weekly sprint we go over them one-by-one.
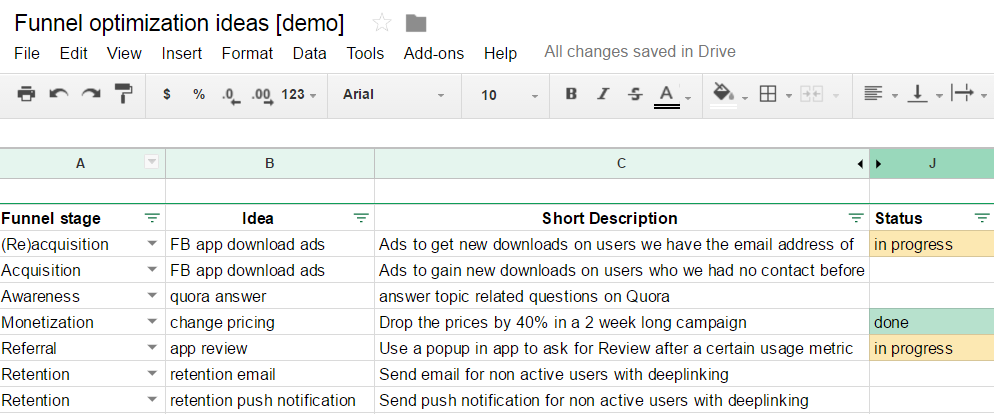
We track the funnel stage the idea is supposed to affect, a short description, the Gain, the money needed, the man-hours, and resources required, the time to take effect the potential impact. We also track the status of each task.
You can access this spreadsheet here:
It is very similar to what Sean Ellis calls high tempo testing:
This funnel optimization idea document is super useful because this builds the bridge between the user journey document and the mobile growth stack framework.
The user journey doc + funnel optimization idea spreadsheet helps us navigate where to focus our efforts, and Andy’s framework shows us how to successfully carry out that idea.
It is a nice combination of these 3 elements. It has been working extremely well for us, so might want to give it a shot as well!
If you think about growth as a process and not a tactic, you’ll be much more successful at it. And the mobile growth stack can definitely help your company become more structured and organized around the winning processes!
Do you also use the framework? Have some tips and best practices? If so, please share them so we can all get the most out of it.
Worth the read?
Enjoyed the article? Please let me know by clicking the ❤ below. It helps other people see the story!
Table of Contents

