
One of the first things a Growth PM should set up is a Growth Model.
A Growth Model is a representation of the growth mechanics and growth plan for your product: a model in a spreadsheet that captures how your product acquires and retains users and the dynamics between different channels and platforms. Having a well-tuned growth model for your product is important for several reasons:
- A growth model can help you forecast how much growth to expect over a certain period of time, based on the information and assumptions you have. Are your growth expectations wild dreams, or not? A good model can help bring predictability to your growth forecast.
- It can also help you simulate growth outcomes for different initiatives. This is incredibly important when you are prioritizing growth projects: you can insert the expected results of individual projects into the model and see immediately what impact they will have overall. For example, say you have a project that you predict will increase month 1 retention by 5%. What impact will that have on MAUs six months later? You will just need to plug the new retention numbers into your model, and you’ll get an estimate.
In this article, we’ll set up a very basic growth model and look at some of the important dynamics that you’ll want to capture.
Before we begin, it’s important to note that every growth model is different, just as every product is different. There is no one-size-fits-all model that works across all products, but there are some general concepts and mechanics that you can use to build the model that’s right for your product.
Let’s get started.
First, let’s start by looking at a bad growth model. Here’s an example that I see all the time:

What’s wrong with this? This model violates the golden rule of growth models: Growth Models are about inputs, not outputs.
This model is based on one primary mechanic: starting with a principle user base of 5k MAUs, the product will grow at 15% month on month, every month. The problem with this is that it doesn’t tell us anything about where those users are actually coming from. Why will the user base grow at a neat, consistent rate of 15% month on month? Where will all those new users come from?
This model has very little predictive power, because based on the information here, you really have no idea what your month on month growth rate will be six months from now. At this point it’s a model based on hope rather than reality. Additionally, this model has no analytical power. Say you compared your actual performance in month 3 against this model, and found that your actual growth rate was only 5%. What can you learn from that? Why was it only 5% and not 15%? Where did you under-perform? Were more uses churning, or were some of your acquisition channels down? There’s no way to get any insights by looking at this model.
Growth Rate is an output. It’s something you calculate as a result of the other dynamics as a model. If you find yourself putting in the growth rate as the core mechanic of your model, you’ll have a problem.
Andrew Chen has a great post about what’s wrong with these kinds of models, and how to fix them.
Now that we’ve seen a bad model, let’s build a better one.
We discussed above that growth models are about inputs, not outputs. So what are the inputs to a growth model?
There are three kinds of inputs that form the essential dynamics of your model:
- Acquisition channels: where do new users come from?
- Retention: how well do you convert new users into active users, and how well do you prevent them from churning?
- Growth Loops: what dynamics exist inside your product that turn one cohort of users into another cohort of users? The best growth models have strong growth loops: virtuous cycles that accelerate your growth.
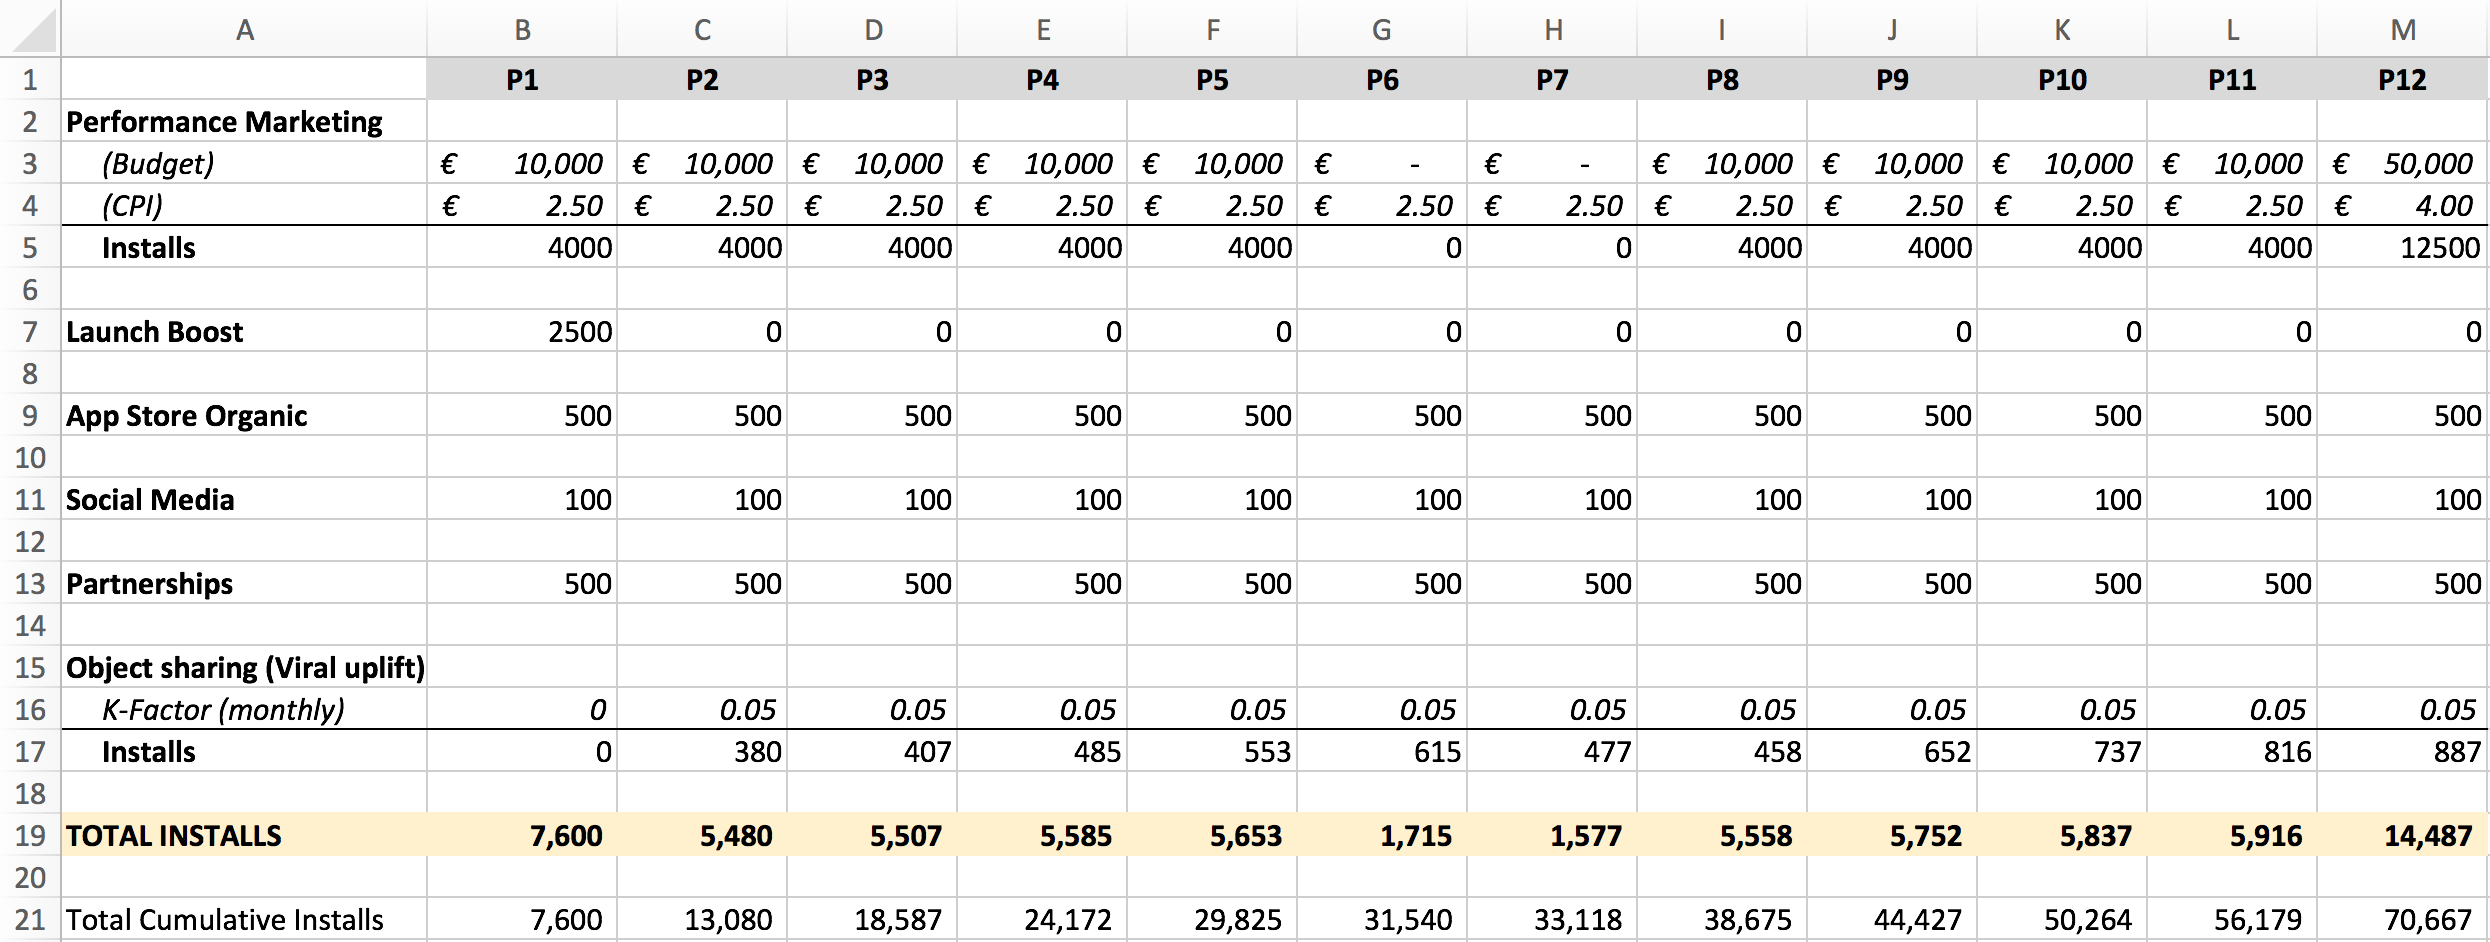
The first input is your acquisition channels, so let’s start there. For this example, let’s assume that our product is a mobile app, and a modest performance marketing budget is expected to be the main driver of installs. Start your model by plugging in your monthly acquisition budget and the estimated CPI (cost per install) to model your acquisition over 12 months. For example:

Perhaps you’re also expecting a boost of downloads when you launch (the “TechCrunch effect”), some ongoing organic App Store and social media traffic, and a co-marketing partnership. Your acquisition channels might look like this:

How do you know how many organic app store installs you will have, or how many from social media? If the product is new, then chances are you won’t know. It might be a best guess estimate at this point. That’s ok. Once you’ve been live for a month or two, you’ll see how much traffic you are really getting, and you can update your forecast model as appropriate. As a general rule of thumb, use real reference data wherever you have it; otherwise, use your best estimate.
Now you’ve modeled your incoming acquisition channels. But how many of them are you keeping? To understand your MAUs, you’ll need to apply your retention dynamic.
If your product hasn’t launched yet, you won’t have 12 months of retention data to apply to the model, so use your best estimate, and update your model every month with actual data. To start with, it might look something like this:

Then you can apply the retention dynamic on a monthly cohort basis to your acquisition channels to calculate your MAUs:

From 64,200 installs throughout the year, you can expect 25,363 of them to be active after 12 months, based on the assumptions you have.
This is the first time a Growth Rate should appear anywhere in your model. And as you can see, it is calculated based on the inputs to the model. It’s an output, not an input.
The last thing you want to add to your model is any additional accelerators or loops that are operating on top of your acquisition channels. Let’s assume our product has a sharing feature that allows users to share objects with friends, and let’s further assume that this feature leads to an average of 5 new installs for every 100 users each month (a viral factor of 0.05). Add this to your model to understand the boost in installs from the viral sharing feature.
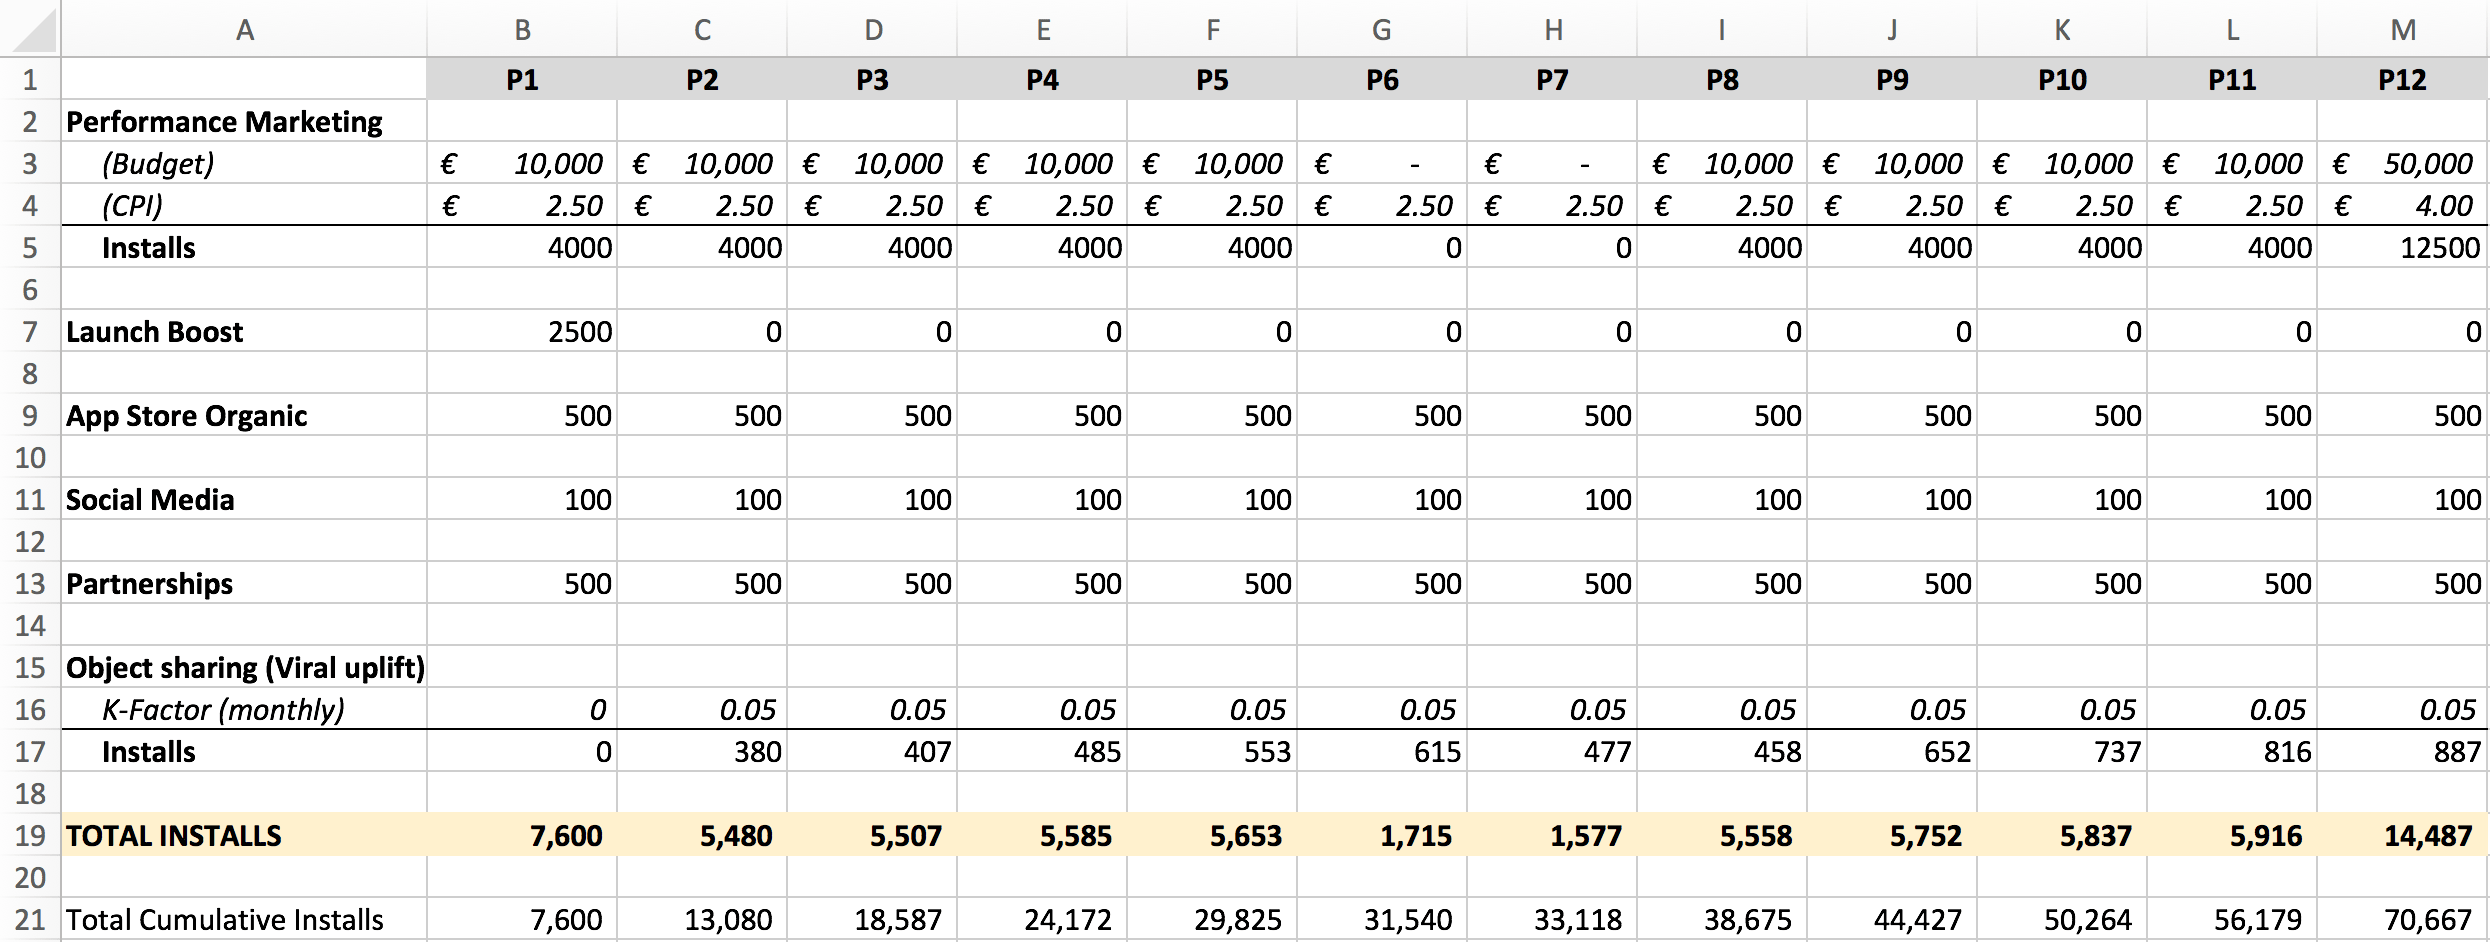
And your MAU growth is going to look like this over the year:

A Growth Model is an important way to describe your growth engine in a systematic way, and it’s a critical tool for forecasting and simulating growth outcomes. But your model will never be perfect. Every model is based on assumptions and incomplete data. Try to make it as accurate as possible by using real data wherever possible, but don’t worry too much that it’s not 100% accurate.
As George E. P. Box, a British statistician, once said: “Essentially, all models are wrong, but some are useful.”


