By Luca Giacomel — Head of Game Development & former Data Scientist @ Bending Spoons

Ah, how original..! I decided to create an open-source tool called Sherlock. There are only 1,735 other projects with the same name on Github.
A screenshot depicting my frustration in realizing I am terrible at branding
Nevertheless, I don’t think I can be blamed for being a huge fan of the TV series named after the famous Conan Doyle detective (and yes, you probably have already spotted the first issue with my tool, Sherlock was the detective and Lestrade was the Inspector, but honestly, who remembers the clumsy inspector Lestrade?)
The philosophy behind Sherlock
The tools ASO practitioners use during their everyday work are often quite expensive and are mostly hosted by vendors. Now, I clearly have nothing against this. It allows for great ease of use (you don’t need to worry about running stuff) and vendors are usually great guys (👋 vendor friends!) who try very hard to push the boundaries of ASO by creating great tools.

🕵️♂️is already solving your ASO mysteries (image rights belong to BBC)
However, as a person-that-does-stuff-with-data, I felt like there was a need for openness and transparency in the way we construct the most basic algorithms to analyze and evaluate our work. This is why I created Sherlock, an open-source tool that anyone can run locally with their own personal data to produce reports on conversion, downloads, update impact analysis, seasonality, and uplift. Behind the scenes, Sherlock is heavily based on a library I wrote, PM-Prophet, which is essentially a more flexible implementation of a generalized additive model for time series by Facebook (also called Prophet).
Please note that I mostly work with the App Store. So while most of the things below can also probably apply to the Google Play Store, some might be strictly App Store specific.
Now, let’s see how conversion, downloads, and K-Factors can be modeled; then we will explain how to install Sherlock, prepare your data and run it to estimate all of this stuff.
Modeling Conversion
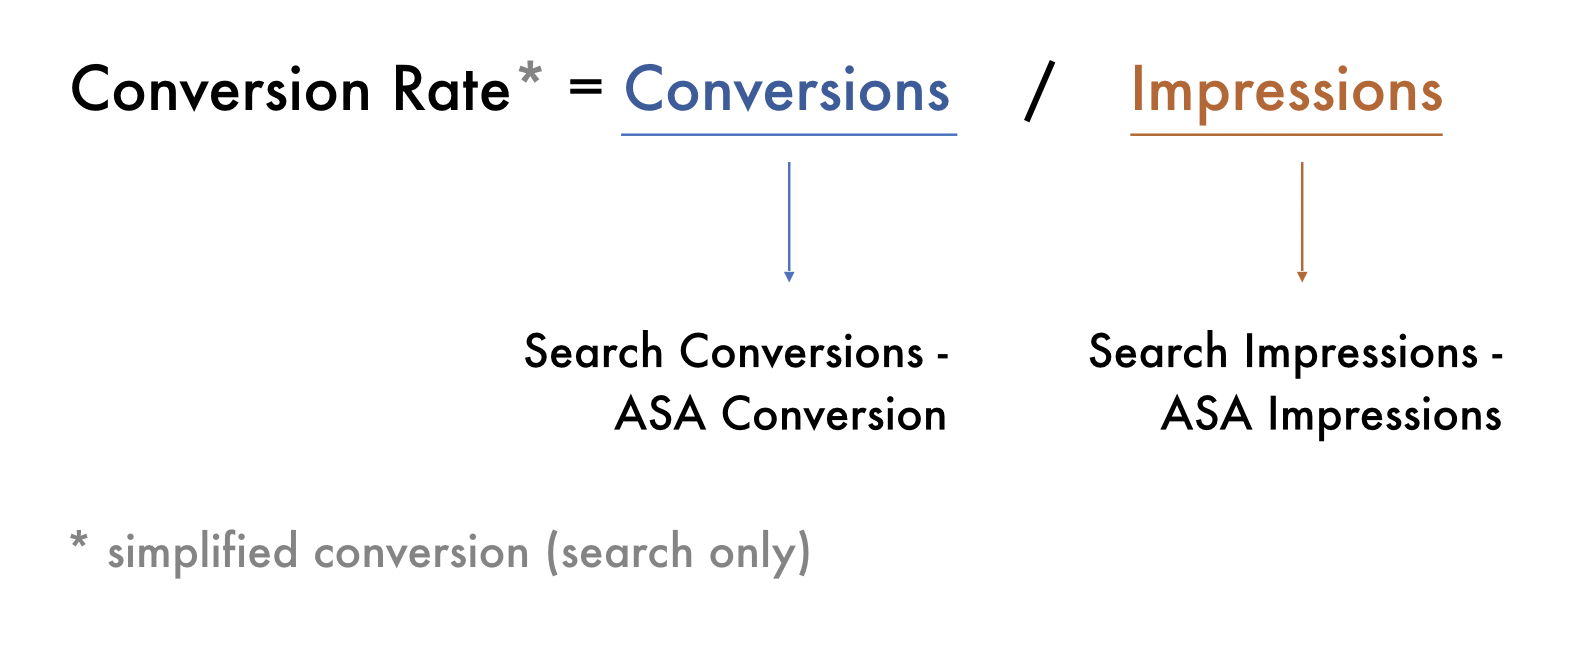
The simplified model for conversion rate
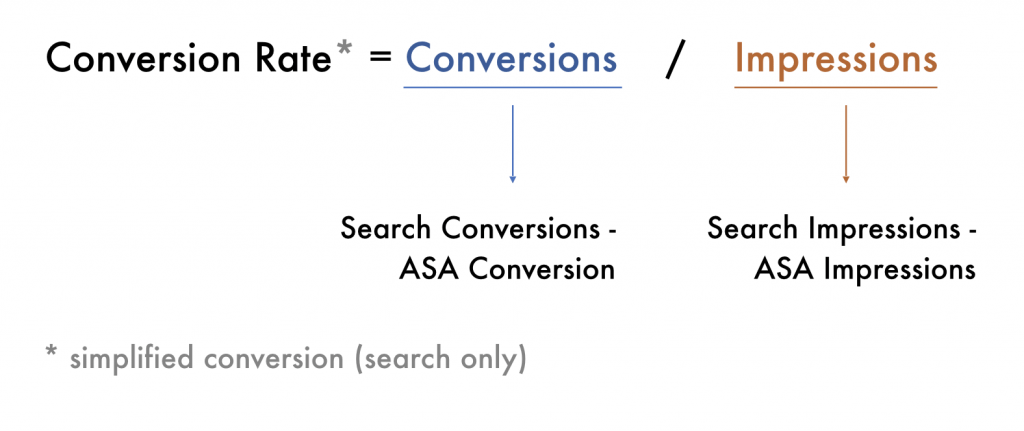
Conversions are the most interesting metric to model when analyzing the impact of a visual ASO update (e.g. a change of screenshot, icon, or app preview). In theory, we could assess the impact of visual updates on downloads as well, but this is often impractical, as conversion has long-term structural effects on downloads due to the way App Stores work. For example, an app that gains in conversion will gain rankings over time, as the stores are able to gather more confidence over their conversion. The simplified search conversion of an app can be defined as the ratio of the search impressions and search units from App Store Connect. Unfortunately, if you are doing Apple Search Ads, search impressions and units will be polluted by that, so we will need to subtract ASA units and impressions from those (Sherlock will handle this automatically, so you don’t need to do it yourself, but rather just feed them to it).
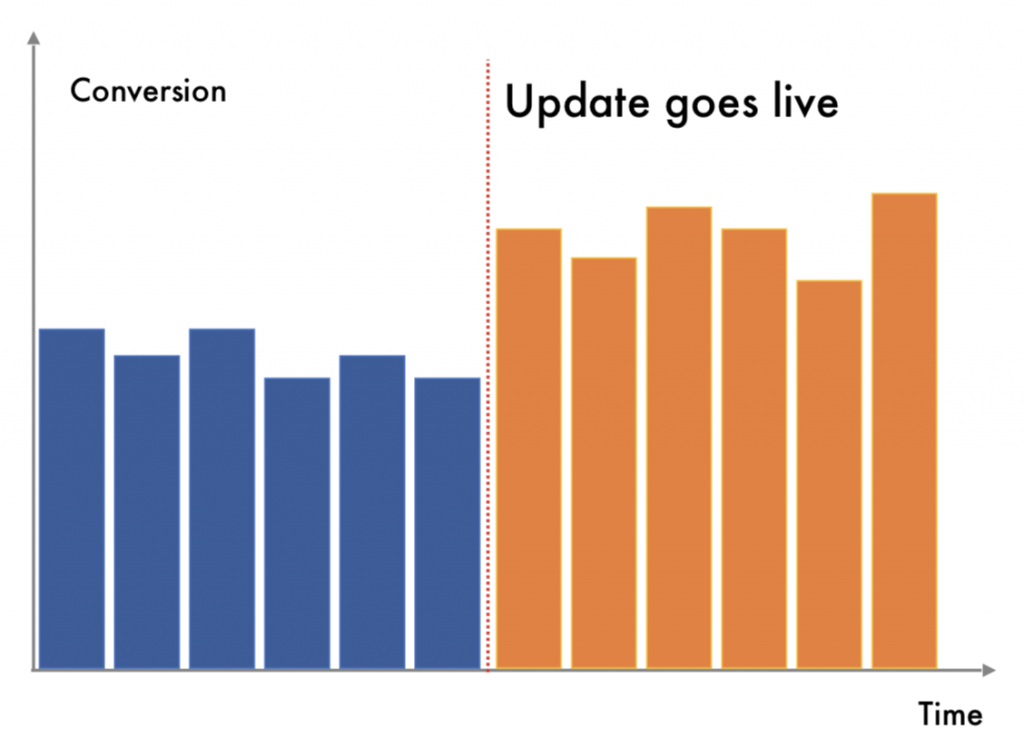
Example of what a successful update impact can be on conversion
Important note: After some research, I formulated a (still not thoroughly validated) hypothesis that search impressions reported by ASC are unreliable before the 1st of March. Thus, just to be on the safe side, don’t rely too much on impression/conversion data before the 1st of March, 2019.
The output for conversion analysis in Sherlock
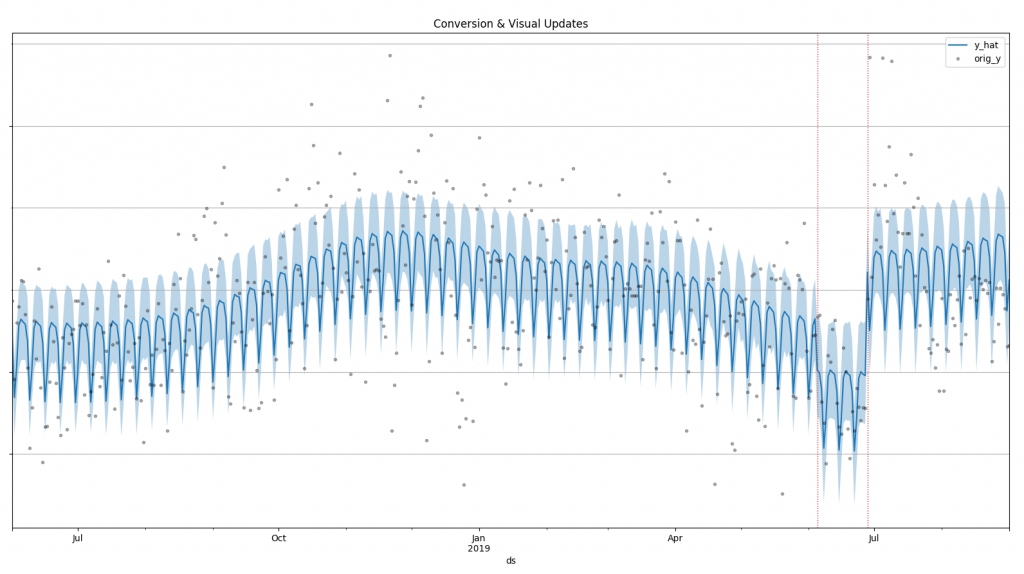
Sherlock output for conversion modeling (data on the y-axis was removed)
The first thing that Sherlock will show you is a visual fit of the conversion model over time, with any eventual “jump” in the time-series in the proximity of your visual metadata updates.
As you can see from the above graph, we also fit a seasonality profile (weekly and yearly, if you have observed more than 365 days of data).
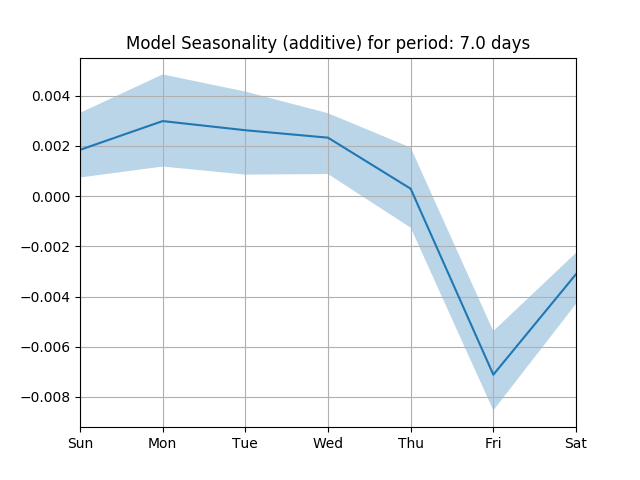
Weekly seasonality fitted on conversion
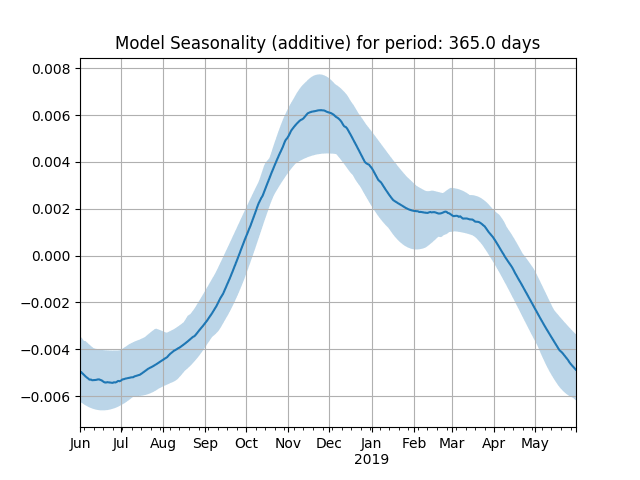
Yearly seasonality fitted on conversion
Sherlock will then also compute the actual numerical impacts of updates. In this case, we can see that the first update was quite unsuccessful and the team quickly managed to do another update that reverted the effects of the old one and improved conversion even further.

Numerical Impact for the above updates (actual dates were removed)
Note: Coefficients for conversion are shown as an absolute effect, meaning that conversion passed from X% to (X-0.6)% in the first update and (X-0.6+1.47)% in the second update.
Modeling Downloads
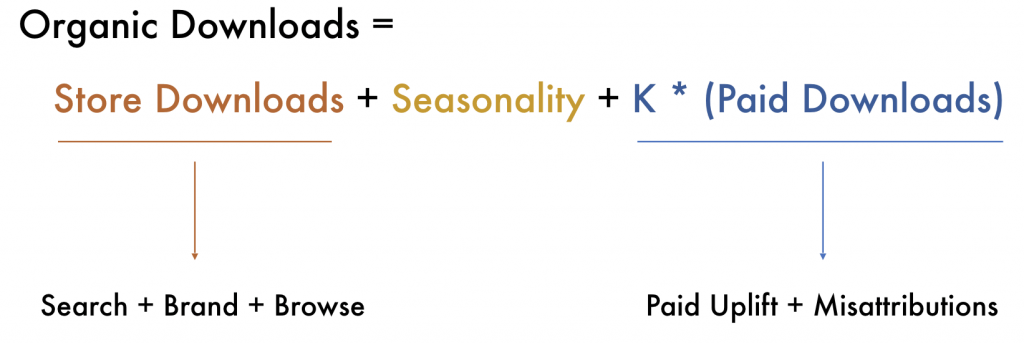
The simplified model for downloads
Downloads are probably one of the most frequently used metrics to look at the performance of an application. Unfortunately, they are quite difficult to model as they are often determined as the sum of many factors. In particular, we have isolated three macro-areas: the total amount of store downloads you make on average (organic searches + brand searches + browse), plus the seasonality (positive or negative depending on the month of the year or day of the week), and a multiplier over the paid downloads you bring to your app (which include virality from paid user acquisition, misattributions, and organic uplift). What Sherlock will try to estimate when fitting on downloads are not just the “jumps” on downloads in proximity to updates, but also the seasonality trends and the K-Factor. This makes for a slightly more complex model than the one for conversion.
The output for downloads analysis in Sherlock
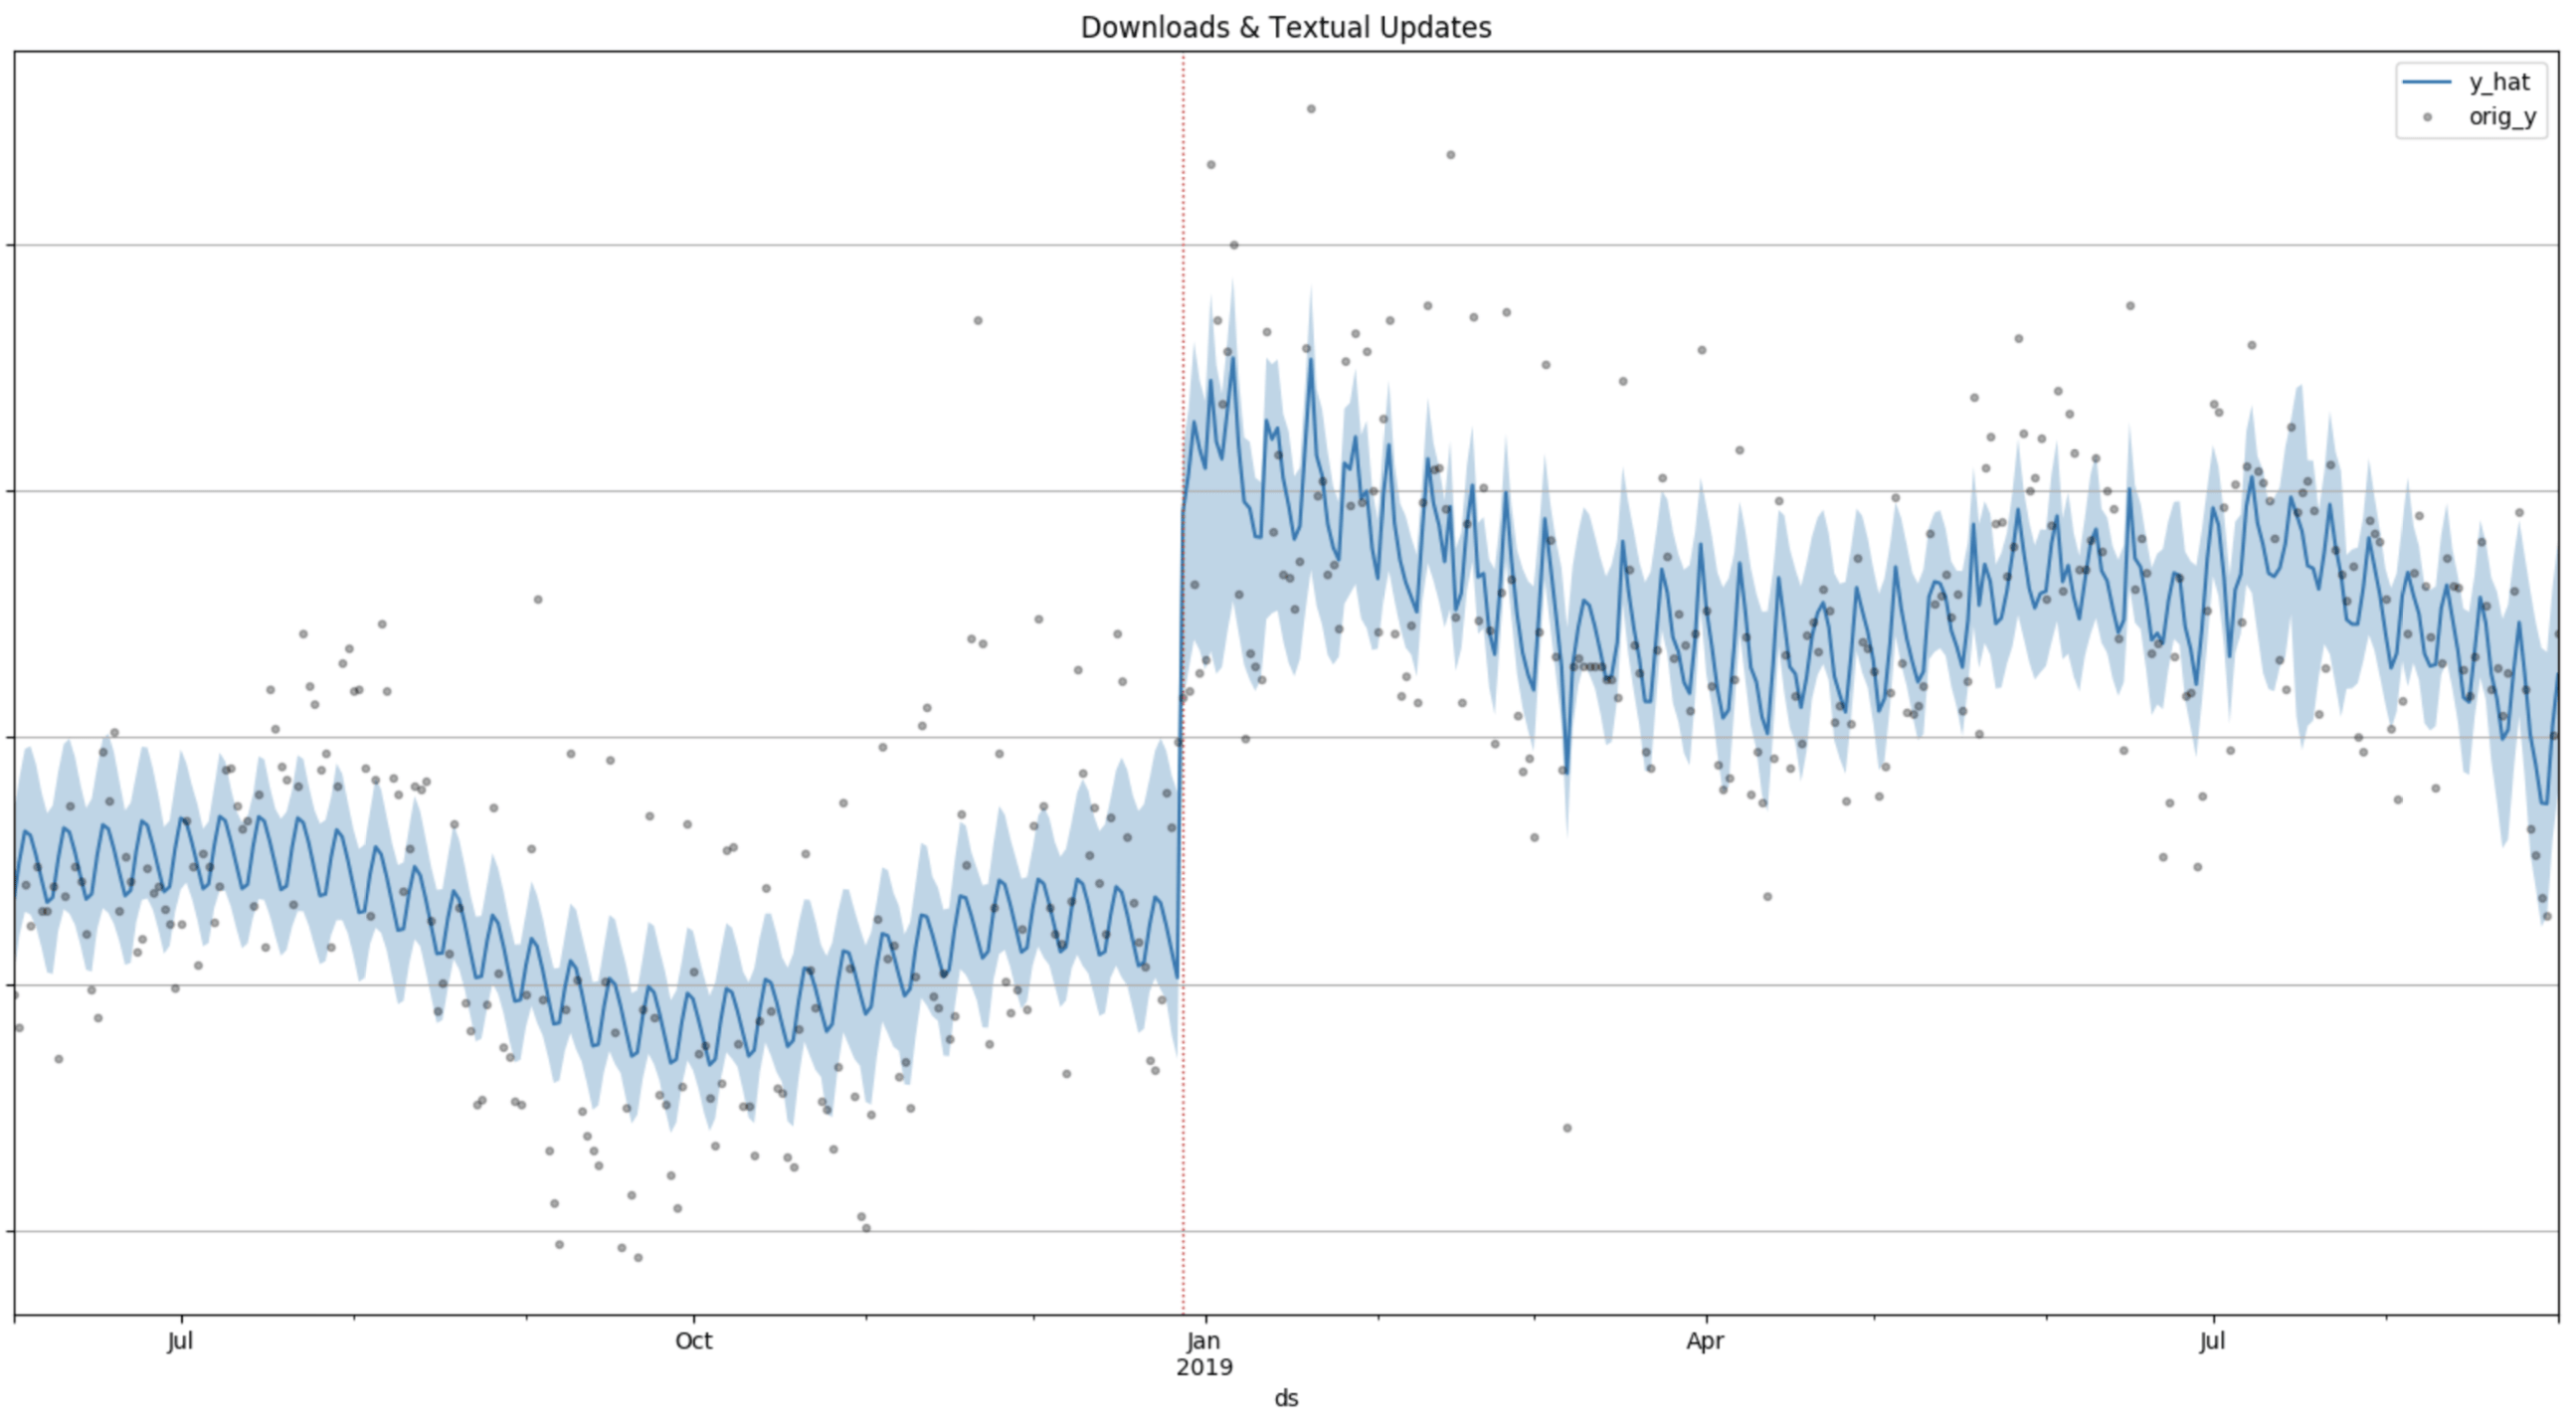
Sherlock output for downloads modeling (data on the y-axis was removed)
Similarly from what we have seen with conversion, the first thing that Sherlock will show you is a visual fit of the downloads model over time, with any eventual “jump” in the time-series in the proximity of your visual metadata updates.
Once again, very similar to what we have shown for conversion modeling, Sherlock will then also display seasonality estimates for the downloads and a table with the effect and significance level from all the updates. This provides you with exact numbers on your performance.
K-Factor Analysis
As part of the downloads model, we will also retrieve values for K-Factor coefficients for all of the extra time series you have provided (e.g. ASA conversions, Facebook conversion, Snapchat conversions, etc). For each of the time-series, Sherlock will plot a histogram of the posterior distribution for the K-Factor.
Fear not! The posterior distribution is actually something fairly simple to understand. It’s simply a graphical way to describe which values are more likely to be the “real” K-Factor. The higher the bar for a particular range of values, the higher the chance the K-Factor will be within that range of values. However, we want to be particularly careful that the histogram doesn’t include both positive and negative values, otherwise, we would be unsure if the effect is positive, negative, or neutral. Therefore, if the histogram bars cross the zero, the K-Factor will not be significant.
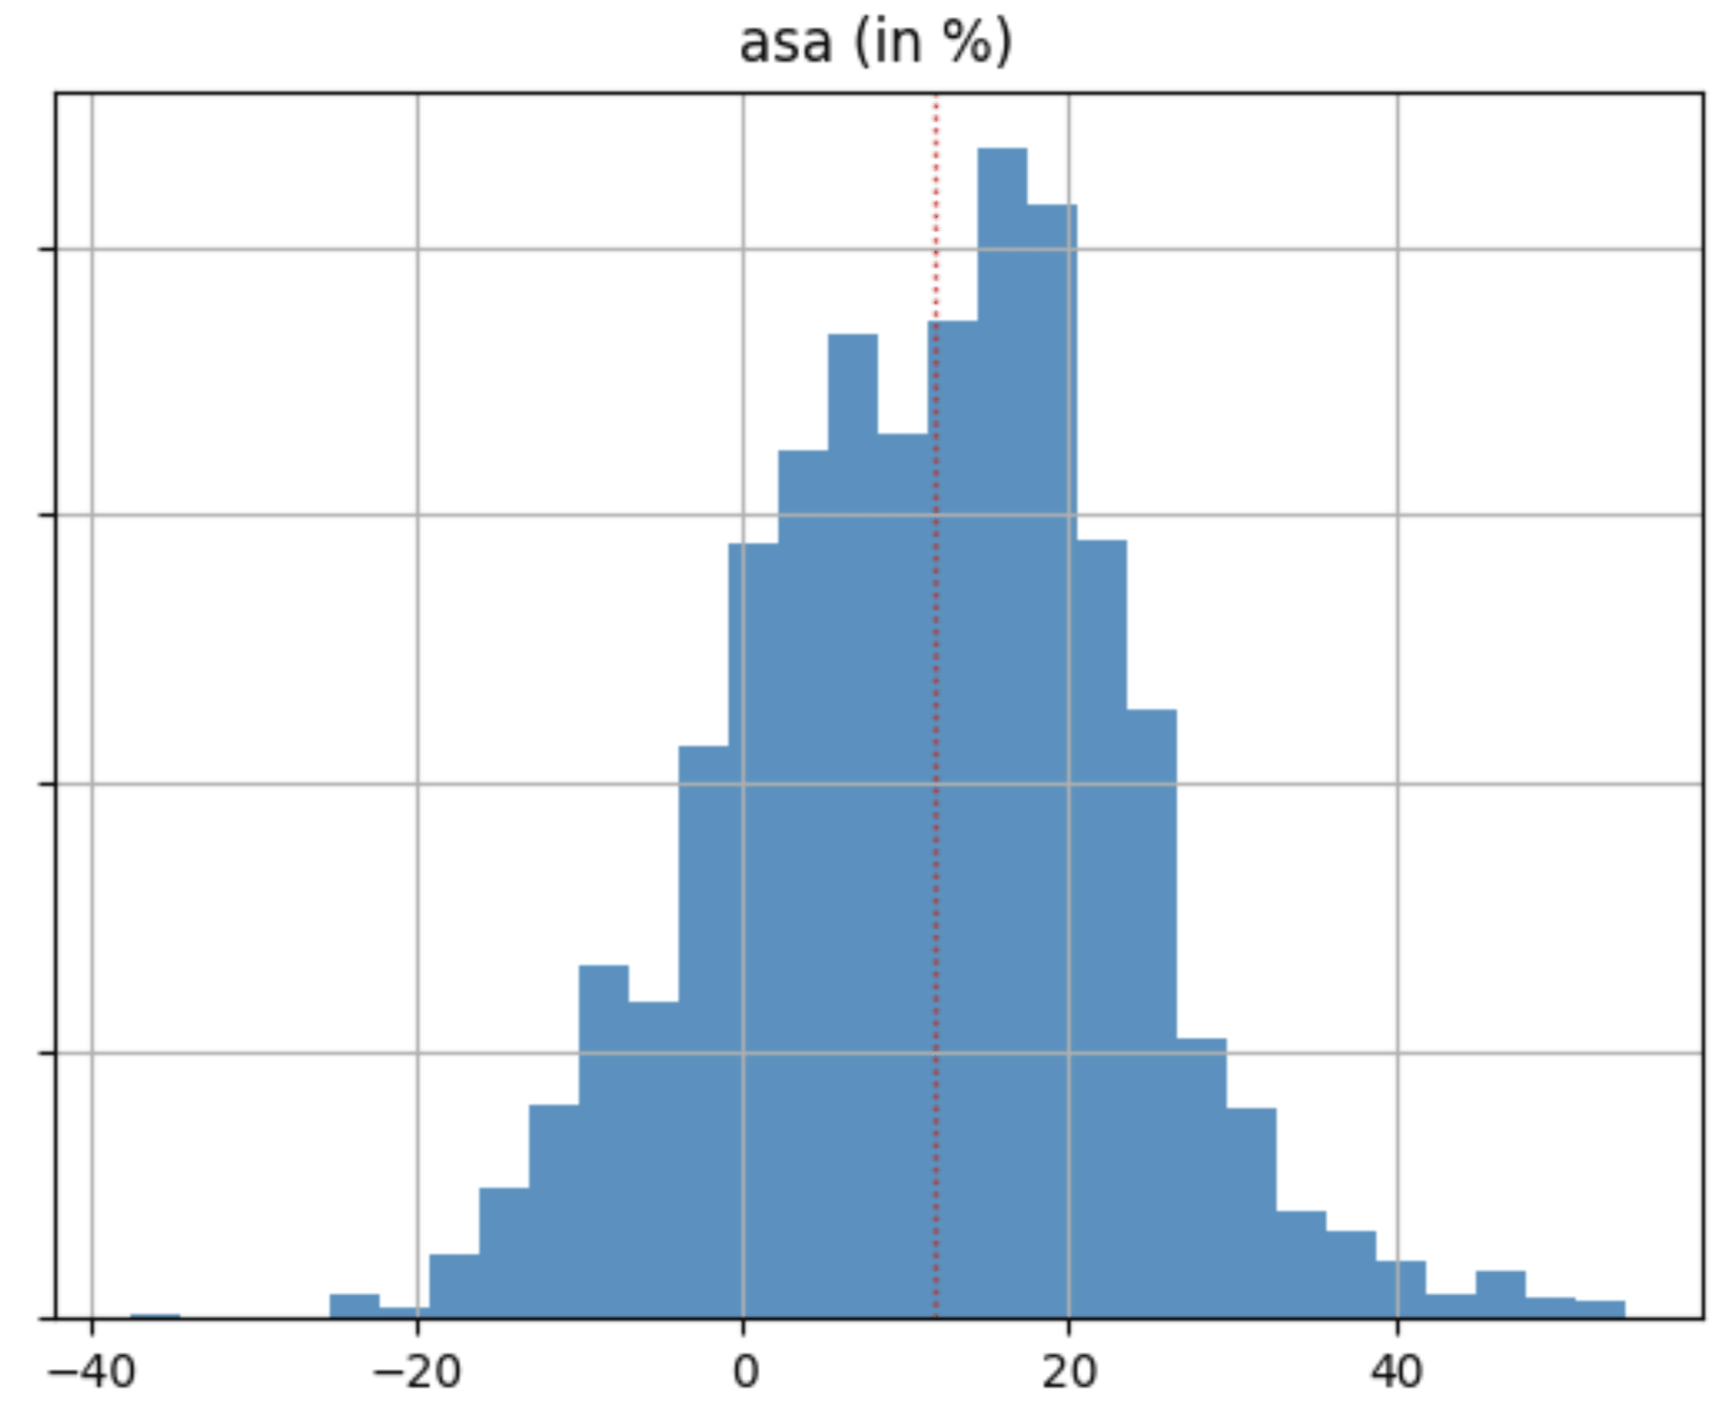
An example of a K-Factor estimate. As we can see here, the K-factor can take both positive and negative values, so regardless of the fact that the median value is ~15% we cannot conclude that the result is significant.
However, you don’t need to worry about being able to read the histogram. The results of the K-Factor, its significance, and the error associated with Sherlock’s estimate are, once again, displayed in a table in the summary.
Installing Sherlock
The following instructions are for Mac OS users. I assume that if you use Linux you will know how to do this stuff, while for Windows users, I highly suggest you get a developer to help you install this. We will install four programs, which are needed to run Sherlock (Brew, Git, Python3, and Pipenv). Feel free to skip installing programs that you have already on your computer.
- Open your terminal by typing in “terminal” in Spotlight and opening the app.
- Install homebrew by typing /usr/bin/ruby -e “$(curl -fsSL https://raw.githubusercontent.com/Homebrew/install/master/install)” and pressing return.
- Install Git, Python3 and pipenv with brew install git python pipenv
- Clone the git Sherlock repository locally with git clone https://github.com/luke14free/aso-sherlock
- Type cd aso-sherlock to move into the Sherlock folder you have just cloned on your computer.
- Install dependencies with pipenv install
Et voilà, you should be good to run Sherlock!
Preparing your data for Sherlock
Preparing your data for Sherlock is quite easy. Simply download search conversions and impressions from App Store Connect, ASA units, impressions from Apple Search Ads, and eventually any other data from your MMP. Then create a spreadsheet that looks like the following one (which is also available here):

Example spreadsheet
More precisely create the following columns. Don’t mess with upper and lower cases; everything should be in lowercase to be recognized by Sherlock:
- date this should be a column of dates for your observations. It’s important that you use the European 🇪🇺day/month/year format with leading zeros (e.g. 01/12/2019).
- update this is a column that should contain the text visual if on that date you have done a visual update or textual if on that date you have done a textual update. Keep these texts in lower case! Remember: never do a visual and textual update at the same time.
- search_downloads this is a column with the daily number of downloads from searches that you can obtain from App Store Connect.
- search_impressions this is a column with the daily number of impressions from searches that you can obtain from App Store Connect.
- [optional] asa this is a column with the daily units from ASA, that you can obtain from Apple Search Ads.
- [optional] asa_impressions is a column with the daily impressions from ASA, that you can obtain from Apple Search Ads.
- [optional] add any other column of your liking with any name you want (e.g. a column of Facebook installs by day called facebook).
Now save the file as a csv file in the same folder where you have cloned Sherlock from Github.
Finally, running Sherlock
Now that everything is installed and your data is ready to be fed into Sherlock, you can run Sherlock by opening your terminal and typing the following:
- cd aso-sherlock to move into Sherlock’s directory. If this fails, drag and drop the aso-sherlock directory in the terminal after typing cd and press enter.
- pipenv shell to activate the Python environment with all the libraries needed to run Sherlock.
- python sherlock.py -i YOURFILE.csv to run Sherlock. Note: change YOURFILE.csv with the actual name of your file with the data.
- After this Sherlock will do its magic and if everything goes smoothly it will save its report as areport.html file in the aso-sherlock folder, which you can open with any browser.
There are also a bunch of options you can play with if you feel like tweaking anything. You can find them at the bottom of the Sherlock readme.
Methodology (only for true nerds 🤓)
This section is absolutely optional and is suggested only for true nerds who want to have a look under the hood of Sherlock.
XKCD: Technical Analysis
Conversion model
To analyze conversion, Sherlock models a generalized additive Beta-regression, which is centered around the observed conversion of the app. It’s simple to obtain a re-parametrization of the beta distribution around the mean by having the parameter alpha vary freely and defining beta as alpha*((1- mean)/mean) where mean is the parameter we are actually interested in modeling. To model jumps, Sherlock adds an additional regressor to the beta regression, which is just an indicator function over the subset of dates subsequent to the update. Coefficients are then estimated using the Bayesian Statistic framework pymc3, using either No-U-Turn Sampling (suggested) or Metropolis-Hastings as Monte Carlo Markov Chain algorithms. This allows to compute the posterior distribution of the update coefficients, which easily tells us the probability that the coefficient (and thus the impact of the update) is different from zero (and therefore, statistically significant). To see how seasonality is fitted in this model, refer to the seasonality section of this paragraph.
Downloads model
To analyze downloads, Sherlock models a piecewise generalized additive regression with highly regularized changepoints in growth uniformly distributed over time. The prior on the matrix of the growth change coefficients is a Laplacian centered on zero with a small scale, that allows obtaining lasso-like regularization. The optional change in growth is needed in order to account for any extra effects which might not be captured by the model, such as virality or changes in conversion. The way that “jump” detection in the time-series after updates is estimated is the same that has been explained for conversion, except that the indicator function is actually multiplied by the time-series of the downloads itself, in order to obtain coefficients that represent percentage changes in downloads. The K-Factor is modeled by adding additional regressors to the model, whose coefficients will still have a highly regularized prior. The prior in this case could be a simple exponential, forcing the K-Factor to be just positive. However, due to the fact that one common used additional regressors might be ASA, we cannot exclude negative k-factors a priori due to cannibalization. Therefore we will use the double-exponential also for additional regressors. To see how seasonality is fitted in this model, refer to the seasonality section of this paragraph.
Fitting Seasonality
Sherlock doesn’t do anything particularly innovative to fit seasonality and mainly follows the seasonality fitting which is proposed by the original Prophet model. Essentially, seasonality is fitted as a sum of Fourier Series with order 4 and with period seven days (for weekly seasonality) and 365 days (for yearly seasonality; this is only added to the model if there are observations for more than 1 year at least). The various orders are multiplied by some highly regularized coefficients (a double-exponential whose default scale is 2.5, but you can increase or decrease this through the parameter -k if you want to give more or less weight to seasonality) and simply added together.
Conclusions
I hope you enjoyed this article and that you will be using Sherlock to analyze your app’s metrics. Feel free to reach out to me on twitter @luca_giacomel and make sure to 👏 if you found this article useful. 👋

