In the early days of App Store Optimization, much of the focus pointed towards prospecting, testing and iterating on the best keyword mix, along with running supporting A/B tests. Yet as the nature of app discovery in the stores evolved so, too did the breadth of levers and factors that ASO practitioners needed to consider expanded. The world of ASO in 2019 has continued to evolve, now beset by new dynamics such as high competition, a need to look globally for growth, an increased focus beyond keywords for app discovery, and a monetization push by both stores which has gradually reduced the volume of organic visibility.
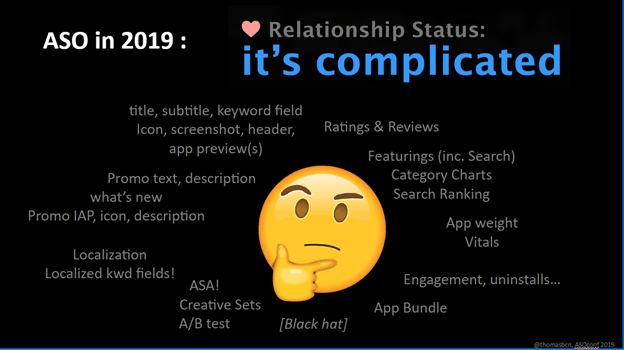
As put by Thomas Petit in the ASO Conference Berlin on May 22nd, if the current world of ASO had a relationship status, it would be: “it’s complicated.”
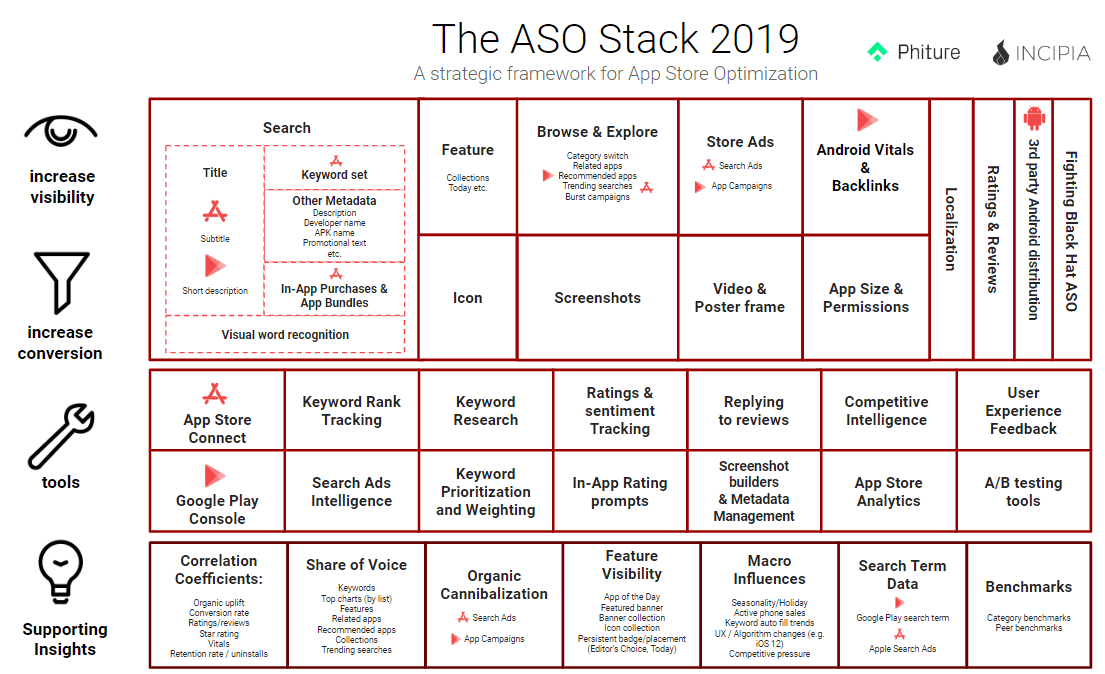
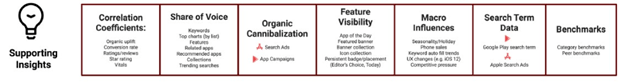
To reflect the nature of this increased complexity in ASO, we decided to revamp the bottom row of the ASO Stack to call attention to some of the most important of these complicated details. Creating this bottom row of supporting insights follows the original goal of the ASO stack, which is to help give defined structure to what may feel at first glance an overwhelmingly complicated set of strategies, and to help ASO practitioners gain a handle on analyzing their ASO strategy in spite of these rising complexities.
Whereas the top two rows of the stack focus on levers and tangible assets or optimization techniques, the purpose of the supporting insights row is to leverage the tools row and custom analytics to inform an ASO team’s decision making, goal setting, and resource allocation, thus freeing up the top rows to achieve their best results. Supporting insights describe underlying factors that, if left out of planning can lead to impossible gaps between expectations and actual results; or, if properly factored can be key to building support to align stakeholders around removing key blockers to an app’s maximum ASO potential. Learning to master the calculation of supporting insights can increase the accuracy of forecasting results, align paid and organic marketing teams, prioritize the most important blockers, educate internal teams and much more.
There are seven supporting insights groupings.
Correlation Coefficients
The algorithms of today’s “maturing” or “modern” ASO are influenced by a variety of factors beyond submitted metadata and are continuously fine-tuned through algorithm updates to take the latest factors deemed as relevant into account (such as excessive app wakeups). This is especially true with respect to Android keyword and related/recommended app lists, which are governed by Google’s vast content discovery algorithm expertise. While both stores have expressed the fact that they study more signals beyond downloads and conversion rate, Google has always exceeded Apple in proving this to actually be the case.
In simple terms, studying your app’s correlation coefficients is a process concerned with establishing a stack-ranked order of the factors which are found to have a significant influence on your app’s organic visibility, and the magnitude of the relationship of each factor with organic visibility.
For instance, if your app’s conversion rate is hovering below your peer set’s benchmark, this could be a significant factor in preventing your app from earning more visibility. Or, if you experience a big increase in inorganic traffic, you may also see a significant increase in your organic visibility.
The factors exerting an influence on ASO performance can be segmented into two main camps of offensive and defensive factors.
Offensive factors power an app’s ability to capture a larger share of visibility, including:
- Organic uplift — this refers to the trend of inorganic downloads such as those from paid marketing to improve an app’s organic rankings.
- Conversion rate — an app’s conversion rate not only helps to turn more impressions into downloads but is a consideration when determining future rankings as Apple and Google’s algorithms desire to show apps which are able to convert visitors into downloaders.
- Ratings & reviews — the volume of users leaving ratings and reviews is considered as a positive ranking factor, similar to organic uplift.
Defensive factors act as a potential penalty zone for apps, triggering a drag on visibility when an app’s performance worsens beyond a certain level or that of its peers. Defensive factors include:
- Vitals — this refers to the data points on the development side, such as crashes, App Not Respondings (ANRs, Android-only), excessive wakeups (Android-only), and others. In modern ASO, these factors can cause an app’s ranking to worsen or prevent improvements if they are at poor levels.
- Star rating — an app’s star rating is a signal that ranking algorithms also consider. Per Google’s upcoming Play Store announcement, Google will also pay special attention to the most recent user ratings.
- Uninstalls / retention rate — if your app churns the users that it acquires at a high rate (at worst via direct uninstall, but also via poor retention rates), this is a powerful negative signal that the users are not having a positive experience. Retention rate may also possibly act as an offensive factor.
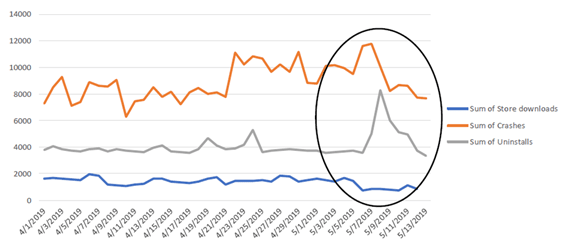
Play Store data showing a worsening in store-sourced download volume after an increase in crashes and uninstalls.
Correlations refer to the relationship between the above factors and an app’s organic visibility. That is, are the offensive and defensive factors found to have a significant relationship with an app’s organic visibility?
Coefficient refers to the calculated magnitude of the relationship between the correlated variables. That is, for each change in a independent variable (e.g. inorganic downloads), what was the observed change in the dependent variable (i.e. organic downloads)?
While there are many ways to calculate correlation coefficients (and many more to actually predict what organic visibility may be considering a host of factors), one of the most popular methods used to calculate correlation coefficients is a regression analysis.
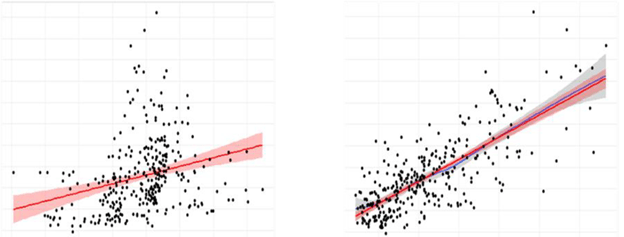
A visual from a regression analysis showing variables found to have an insignificant correlation (left), and variables with a significant correlation (right).
The most commonly studied factor to date has been organic uplift, calculated in the form of “1 additional paid download is correlated with an uplift of X organic downloads;” through regression analysis, the same calculation can apply to the other factors as well (albeit with different potential interpretations, such as rate-based factors). A few caveats to be aware of include:
- Coefficients will differ from factor to factor, app to app, category to category, country to country, and store to store.
- Coefficients can differ based on macro factors such as competitive pressure or seasonality.
- Coefficients may experience different levels of magnitude depending on the level of scale involved. This is because of the non-linear nature of app store visibility and the fact that once an app reaches the top, there are no more rank gains to be had (although other factors such as word of mouth, changes in auto-fill results, and seasonality can extend yield beyond any one algorithm’s maximum rank).
- One crucial challenge to using regression analysis to study coefficients is that it requires a sufficient number of observations, with significant variation in the variables in order to effectively assess the significance of the relationship. For example, if your app’s retention rate has remained unchanged for an entire year, it would be difficult to tell whether retention rate is a significant factor, because there would be no observations from periods of higher or lower retention rate that could indicate whether organic visibility had a linear relationship during those periods.
Share of voice
With the maturation of the App Store (i.e. increased competition, more complex discovery processes, wider access to data & trends, more aggressive monetization, etc.), managing a modern ASO strategy should also include studying an app’s potential share of voice.
Share of voice refers to the share of impressions available to a particular app in a particular set of stores/countries. The purpose of studying share of voice is to inform your ASO team as to how much visibility your app can possibly achieve, thus enabling a more accurate assessment of the growth potential for an app. Some of the uses of share of voice include:
- Planning growth targets for organic
- Prioritizing resources (e.g. marketing budget for organic uplift)
- Determining the contribution margin of organic to an overall growth strategy
- Prioritizing ASO tactics (e.g. unlocking growth from featuring vs keywords vs top charts vs app lists)
To understand an app’s total maximum share of voice takes into account the which countries and category(ies) an app operates within and the macro factors of those markets, such total in-market users, new phone sales trends, localized store monetization trends, and how many apps the total addressable userbase tends to download.
Typically more important than estimating total maximum share of voice is the total potential share of voice, which takes into account competitive pressure and seasonality, as well as other more micro-level factors such as offensive/defensive ASO factors and featuring potential.
There are several dimensions to consider when estimating share of voice:
- Operating system
- Store (including Android 3rd party stores)
- Country
- Visibility source
- Keywords
- Top charts (by country / category)
- Features
- Related app lists
- Recommended app lists
- Collections/editorials (iOS)
- Trending searches (iOS)
One important note for share of voice (and for correlation coefficient analyses) is that share of voice should assess the top-level visibility (i.e. rankings or impressions), rather than downloads. This is because downloads may be higher or lower for the same number of impressions due to an app’s conversion rate, which can fluctuate with time/optimizations/competition/etc. So analyzing share of voice (or correlation coefficients) at the download level factors your app’s conversion rate into the equation, rather than applying that as a second step and giving you a sense of how many more downloads your app could receive if it had a better conversion rate.
Downloads are the 3rd level of organic visibility.
Estimating share of voice can be difficult to due given the myriad, dynamic influences on the maximum and potential share of voice, but a few methods include:
- Using a Competitive Intelligence Tool such as App Annie to estimate total maximum share of voice.
- Using a Keyword Research download estimation tool, such as AppTweak to estimate the total maximum number of keyword-sourced downloads available.
- Using an ASO tool to estimate the number of downloads from an app that is heavily featured, is the #1 top-chart ranked app, or owns most of the #1 ranks in keywords or app lists, and setting this as the total maximum share of voice.
- Using an ASO tool to estimate the number of downloads from an app that is a good competitor benchmark to beat and setting this as the total potential share of voice.
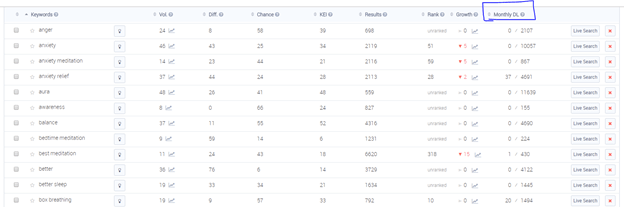
AppTweak’s organic download estimation tool.
For example, if your app is the 15th ranked app in a category, has average keyword ranks and has never been featured, then there is a large additional swath of visibility that can be earned from the total maximum share of voice; but if your app faces large competitive pressure, an inability to get featured and poor defensive factors, then your app may have achieved its total potential share of voice. Or, if your app is performing extremely well in a single market yet no effort has been invested into localization, then spending effort optimizing the offensive/defensive ASO of the app in other markets can push the total potential share of voice closer to the total maximum share of voice.
One major challenge with estimating share of voice is that it is difficult (or expensive) to estimate the number of downloads in a market or the total share of an app’s downloads sourced from organic sources-only. Inorganic downloads are often a large part of an app’s downloads mix, and even apps which have a large share of organic downloads may owe most of their downloads to a large brand awareness (more-so than the non-branded visibility they receive), which may not be representative of your app’s situation. That said, these total download estimates can help establish the picture of potential share of voice, given that if your app does not have the potential to earn the levels of total downloads that competitors drive, it is very difficult to over-optimize the other offensive ASO factors enough to usurp the rank spots that more popular apps earn.
Organic Cannibalization
The topic of organic cannibalization has been one of rising importance as both Apple and Google increase the monetization rates of their stores.
Cannibalization refers to the downloads that an app would have received organically due to users downloading the organic result, yet are earned by an ad for the app because users download the app from the ad result. In other words, cannibalization refers to the propensity for ads to take credit for downloads that should be attributed to organic.
The inverse of cannibalization is incrementality, or downloads which were only possible to be earned through an ad. An example of incremental downloads are those that come from keyword ranks which the organic result does not rank in visible positions for, or at all, such as competitive searches.
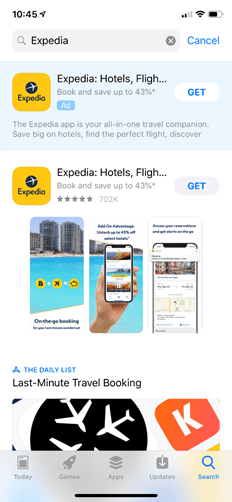
Examples of ad placements which can cannibalize downloads from the organic rankings.
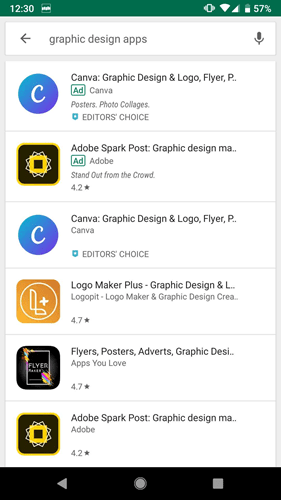
Examples of ad placements which can cannibalize downloads from the organic rankings.
One of the simplest, most popular methods to analyze cannibalization is to run an “on/off test,” where all store ads are paused for a period, and the number of organic downloads is compared during the “off” period and the “on” period.
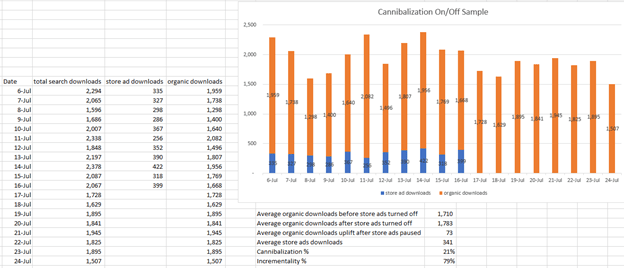
Sample analysis of cannibalization using the on/off method
When analyzing cannibalization for your app it is important to note that while cannibalization is not desirable, some level of cannibalization is unavoidable, and store ads are still important for maximizing visibility. The placement of non-organic app results in the search engine results page for iOS in particular increases the need to run store ads, to stay above the fold and earn downloads.
In this keyword search, there are no organic app results, leading to a lower potential cannibalization level.
Note that while cannibalization most often focuses on store ads (i.e. Apple Search Ads ad Google Ad Campaigns) because store ads show in the same view as organic results, cannibalization is also possible in ads that are placed from outside of the store, especially in the age of view-through impressions.
Feature Visibility
Not all features are created equal; feature visibility refers to the difference in downloads that different feature types generate.
The following feature types are listed from the smallest to largest impact, with App of the Day generating the most significant results (e.g. 22x or greater the number of downloads of a smaller or shared feature):
- Icon collection (shared with other apps)
- Banner collection (shared with other apps)
- Featured banner (single app focus)
- App of the Day collection (shared with other apps)
- App of the Day (single app focus)
Featured banner for Minecraft
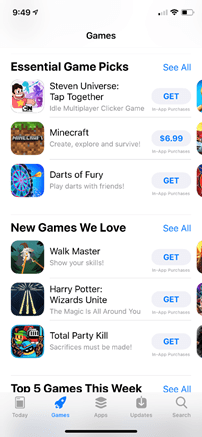
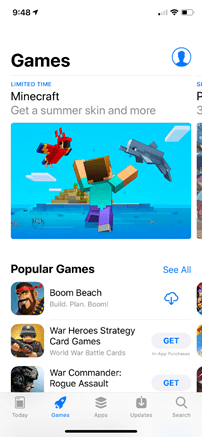
Essential Game Picks icon collection
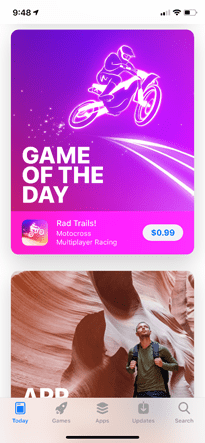
App of the Day for Rad Trails!
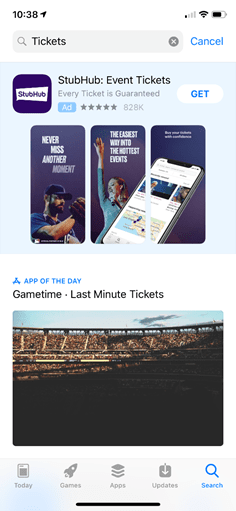
In addition to earning a temporary feature, some features earn a permanent element, such as the Editor’s Choice badge or an App of the Day. Not only do App of the Day results show below an app’s branded search (serving as competitive brand defense), but App of the Day Stories can also be placed into non-brand results in high rank locations.
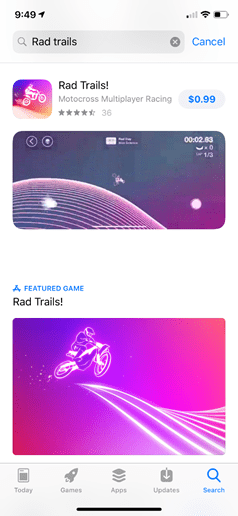
App of the Day for Rad Trails after a branded search for Rad Trails!
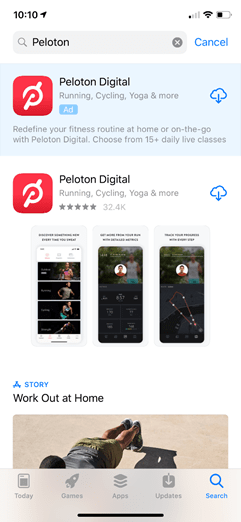
App of the Day collection including Peloton after a branded search for Peloton
Macro Influences
Per the Share of Voice section, macro influences affect the total maximum and potential number of downloads that an app can possibly earn. Macro influences include factors such as:
- Seasonality/holidays — download trends shift throughout the year and can spike during holidays by hundreds or thousands of percentage points.
- Active phones — the total market of people able to download apps in a country (i.e. current active devices in-market, plus new phone sales). Especially of interest as of late is whether Apple can sell more phones in hot growth markets internationally as US sales cool.
- Keyword auto fill trends — a lesser-considered influence of large download trends which involves studying the dynamic trends of which keywords appear in high-volume auto-fill results. Changes in the auto fill trends can cause shifts in download trends (positive or negative) as app names and non-brand keywords rankings change.
- UX / algorithm updates — iOS 11 set plans in motion to push featuring to become a larger share of app discovery for Apple, and Google’s store refresh and push towards personalization has shifted the factors influencing ASO to more indirect, scaled factors difficult to track or optimize. Studying how these macro UX changes pan out is important to maintain and understanding of the avenues to earning organic downloads and where to prioritize current and future efforts.
- Competitive pressure — this refers to competitors’ performance in terms of offensive/defensive ASO factors, as well as incumbents departing the market and new entrants entering the market. Also with the advent of pre-install app rankings, new entrants can now announce their presence and begin capturing downloads before going live, pushing both more warning and more pressure for incumbents.
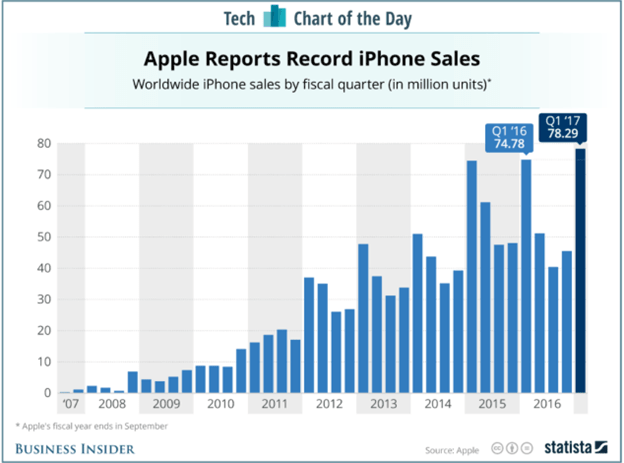
Annual iPhone sales showing multi-year stagnation. Image Source: https://www.businessinsider.com/apple-iphone-sales-yearly-chart-2017-2
Search Term Data
Now that Google Play has released organic search term data, these insights can be mined for keyword research (including optimizing by APRU/retention), as well as analyzed to determine the impact of keyword optimization on actual search term trends.
On the iOS side, search term data can be proxied from Apple Search Ads campaigns. If analyzing data on Search Match or Broad Match, be sure to navigate to the search term tab rather than using the keywords tab.
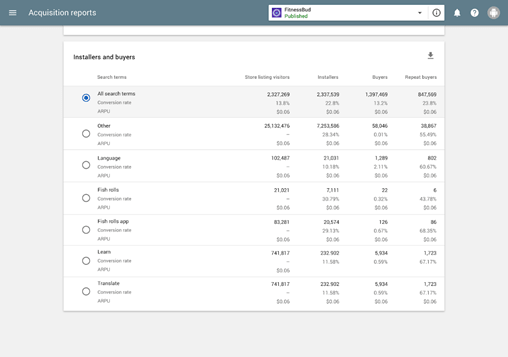
Sample of Google Play search term data from a Google blog.
Benchmarks
Per the correlation coefficients section, performance data is used to determine your app’s organic ranking visibility, and benchmarks are what this data is analyzed against to determine the relative ranking strength of your app. In addition to reporting on offensive and defensive raw data (e.g. conversion rate), be sure to report on how your app stacks up to available benchmarks in order to get ahead of potential problems or opportunities.
Google readily provides many benchmarks, but for iOS some ASO tools such as AppTweak do provide conversion rate benchmarks. For rating/reviews volume and star rating, use you can use your competitor set’s data as a benchmark, and for other metrics that do not have a reliable benchmark, use your app’s historical average to assess whether your trends for those metrics are getting better or worse, and whether this may be affecting your app’s organic visibility.
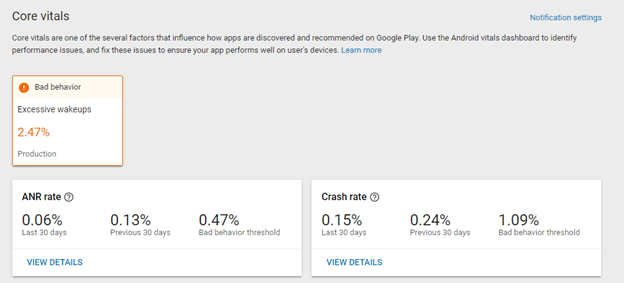
Data on vitals vs benchmarks from the Google Play Console.
Thanks for reading! Let us know if you have questions, comments or ideas on Supporting Insights or other areas of the 2019 ASO Stack.