This post is a modified version of my talk at Litmus Live London on how to build an email growth model and how I used it to increase SoundCloud’s addressable email audience by tens of millions of users. After a lot of requests for the slides I thought I’d share it out as a blog post for everyone to check out.
What on earth is an email growth model and why would I need one I hear you cry! Well if you are running email at scale it is an extremely useful tool to audit, maintain and look for optimizations right through your email program. I developed it during my time running email at SoundCloud to help me get to grips with the inner workings of email there and to understand how valuable email was as a channel amongst all the others that it was working alongside. So let’s dive in.
Why an email growth model?
I see many people in email marketing only looking to influence the parts that they are directly responsible for. Typically that is the creative and email transmission component. But whether it’s ESP set up, sign up flow, landing pages or deep links, these are typically left to the product team. This is a mistake because siloed responsibility in an email program means that you might not be focusing on the highest impact areas to improve your program overall. To be truly successful with email in a mobile-first age, you need to be thinking holistically about your program and not become siloed. Often the highest impact areas lie outside of just content creation.
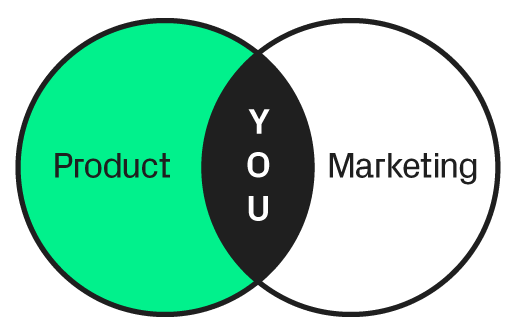
An email growth model will bring data from these two areas together so you can see what is going on. And once you can see what is happening, you’ll be able to start identifying problems and opportunities in your program.
It’s also going to help your project reaching campaign targets. Many marketers running email only have a vague idea of the actual impact email is making when not directly attributed to purchase conversions. And finally, it is a useful tool for ideation and brainstorming to create an experiment roadmap.
Selecting the metric for your model
No matter what your business model, whether a subscription, marketplace, publisher, or whatever, your email program will likely be helping to drive some sort of company-level core KPI or north star metric. That could be a revenue figure, or as broad as MAU or M1 retention. But this is not the metric we would place in the email model as it is too broad and influenced by too many factors outside of email. We’ll want to be choosing a leading indicator metric that directly rolls up to your core metric.
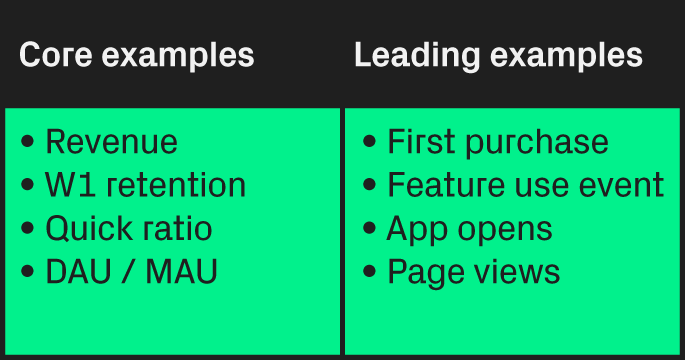
This is something I see often, where teams focus on the wrong metric. For example, a team deploying onboarding email and measuring its effectiveness based on app opens or page views, but not thinking about whether that actually impacts the core metric they are trying to influence, whether that’s month 1 retention or activation.
At Phiture we help clients do linear regression analysis to find leading metrics that impact retention. Some analytics products even have this as standard features now. The important thing here is to make sure you are choosing the right metric for your email model that will move your core metric over time.
Building your email growth model
Ok so once you have selected the right metric for your model, there are three phases of the model you can build, which can be used independently or complementary depending on what you are trying to achieve.
- Basic email funnel model
- Lifecycle segmented model
- Multiple message frequency model
Basic email funnel model
I think that email is one of the most complex channels out there. Depending on your setup, you could have anywhere from 5 to 8 steps in your funnel. Name one other marketing channel out there that has a funnel-like that! And it is precisely this funnel that can make email so challenging to get working for you in a meaningful way.
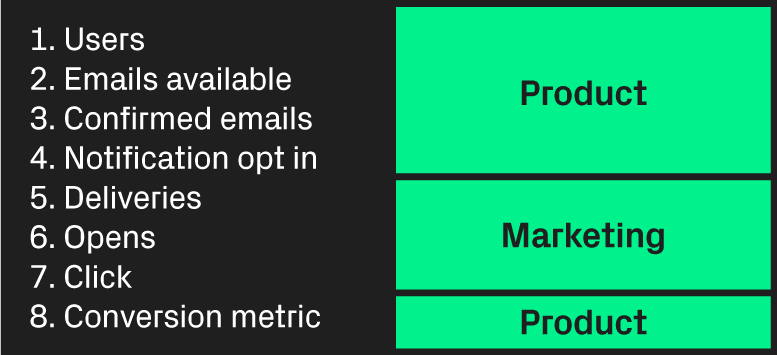
The steps are usually divided up by department responsibility as above, which again brings me back to the point about thinking holistically, which you are going to have to do in order to actually get the data you need to complete it. So let’s quickly touch on these steps and definitions.
Users — Usually this starts at the point of registration, but not always. In the case of mobile, you may have anonymous users tracked via device id.
Emails available — You might have users without emails because you haven’t collected it yet, their email may have previously hard bounced or you may have purged it for email GDPR compliance.
Confirmed emails — The delta between your emails captured and the actual number of confirmed emails when using double opt-in.
Notification opt-in — Opt-in to receive a specific email type. Users may have unsubscribed or turned off email notifications in an account dashboard.
Deliveries — The start of campaign metrics. Delivery failures from bounces to ESP blocks.
Opens — No explanation needed here. Affected by subject line, spam score, sender reputation or previous campaign content quality.
Click — Again obvious. Affected by content quality and email construction.
Page conversion — The final and often forgotten step. Landing page conversion rate on the web or inside a mobile app. Affected by hundreds of things including deep link reliability on mobile.
Inputting the data
So when we start putting this into our actual basic email funnel, it might start to look something like this:
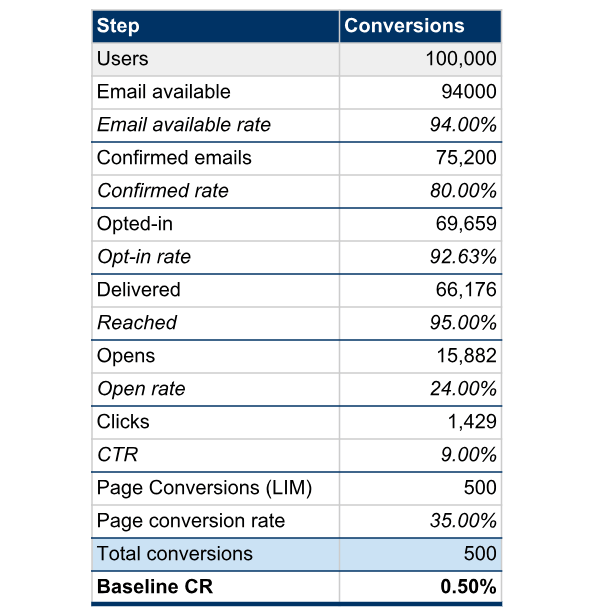
Basic email funnel model
So we start with our number of users at the top, and we see how many of those users have emails available, which is 94% in this case, and then of those perhaps only 80% have actually confirmed their email and we move down the funnel until we have the absolute number of conversions for your leading indicator metric. So when we are looking at our baseline conversion rate for our leading indicator metric, we are looking at the conversions based on the total number of users, not just the total users who received the campaign, which gives you a much better holistic view of your growth opportunity.
So this is the first step, and if this is as far as you went, you would still be far ahead of many other email marketers out there as you would have a complete view of your email funnel. Now, of course, we have campaign data in here, so the question I hear you ask, is what campaign? Or I have loads of different campaigns based on user segments. Well for this step you could aggregate campaign data assuming they have the same conversion metric, or another way to approach this is to move straight to the second variation, which is a lifecycle segmented model.
Lifecycle segmentation
So a lifecycle segmented model is exactly that, it provides a separate model for each phase of the user lifecycle. You can do many segmentations here, but starting with these three most basic steps is how you want to begin otherwise you’ll just make it too complicated for yourself.
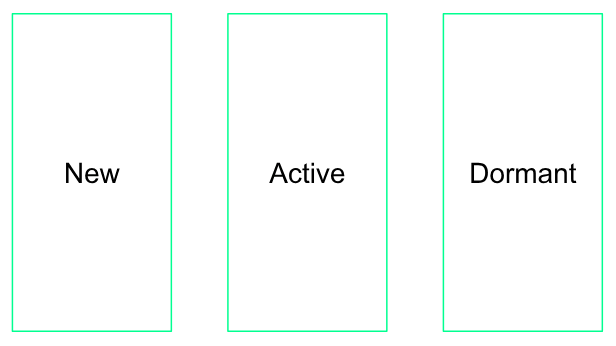
This segmentation is going to help with understanding how your funnel is working overtime and where you might need to focus. So let’s quickly talk about the definitions here.
New users — are exactly that. The question is what time period do you use to define a new user. This will be dependent on your product, but it doesn’t have to be an exact science. It should be a period in which your users have had a chance to experience all onboarding email and perhaps have received some of your active user emails like activity notifications for example. A good rule of thumb would be 1 month.
Active — Actives gives you the primary view on the current status of your email. You’ll want to define this as all users that are not in the new segment that is actually active in your app or site, not based on engagement with your email campaigns.
Dormant — You’ll likely have your own definition of dormant users which should be based on the natural usage frequency of your product. This can be the most difficult step if you are working with a seasonal product or one with a very long sales cycle. Intuition should lead the way here.
Inputting the data
So now that we have this segmented breakdown, we can start to see addressable audience attrition over time and also the effectiveness of different campaigns:
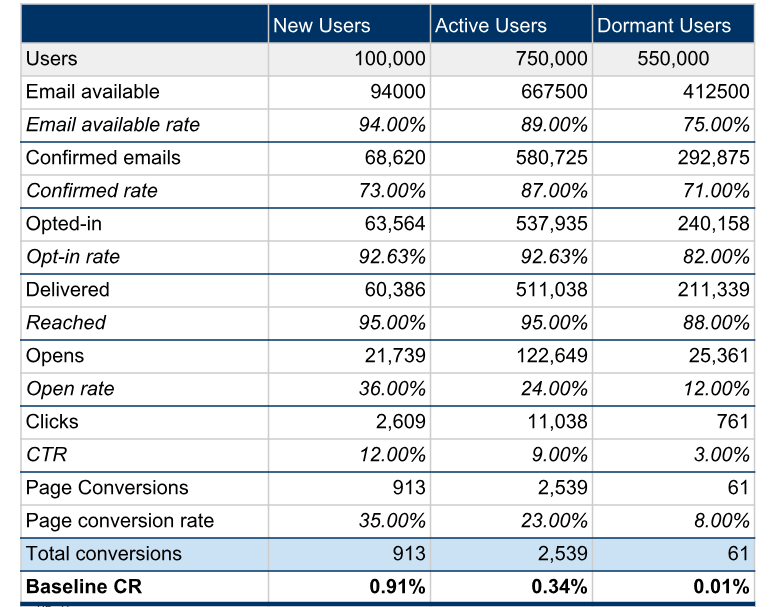
Lifecycle segmented model
An important point here is how to get your campaign data for each of these segments. Ideally, you will already have email campaigns for each part of this user lifecycle so you should be able to pick them out and apply them to the model. Given variances between campaign performance, you might want to take an average across a number of campaign sends to eliminate any singular campaign irregularities.
Multiple message frequency model
And the final variation of the model is looking at the impact on your leading indicator metric based on multiple message frequency. If any of you are working with CRMs that offer a canvas or lifecycle type setup, you’ll be familiar with this. Often our email campaigns are not single transmissions, but a series of emails designed to hit certain goals. So your Easter promotion may have an initial send and then 2 reminder emails. Or perhaps the best example is your onboarding series consisting of 3–4 separate emails.
Here you’ll want to be measuring each campaign’s impact against a control, and this will help you to project how much impact email can deliver independently of your other channels when it comes to forecasting.
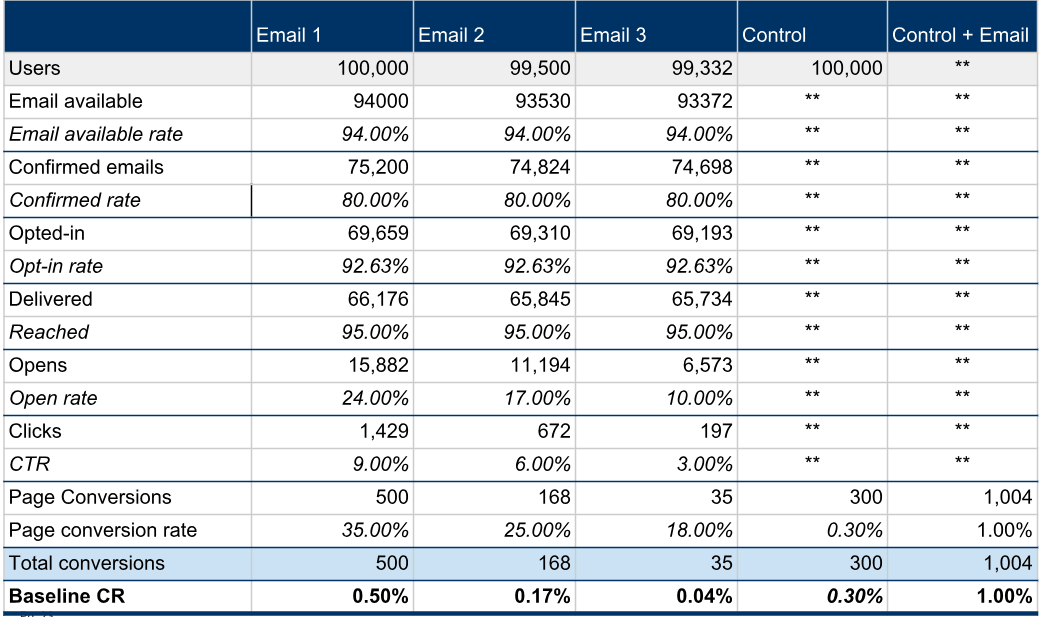
Multiple message frequency model
Here you have your email funnel for each email, and you add up the cumulative impact of all messages to define a conversion rate against your total number of users. You can then measure this conversion rate against your control to see exactly how much impact your email campaign is driving in addition to your organic conversions or conversions from other channels.
So we can see here that the first email delivered 500 conversions, and the second, 168 and third 35, so conversion drops over subsequent messages which is what you might expect. And then we take all the conversions as a percentage of the original audience of 100,000 and we add that to our conversions from the control to get an effective conversion rate of 1%. Now just a note here that this assumes that all the conversions from email would be exclusive of your conversions from other sources, which is likely not the case, but it will still give you a directional guideline that is helpful.
Often you are going to be surprised at your effective conversion rate versus your control, depending on how optimized your email funnel is!
Working with your model
Ok so we’ve constructed the email model with all our aggregated data and have it segmented, so now it’s time to actually use it.
Use case 1: Identifying problems
Now that you have a holistic view of your email program over the user’s lifecycle, you can start to see potential issues that might not have been obvious before.
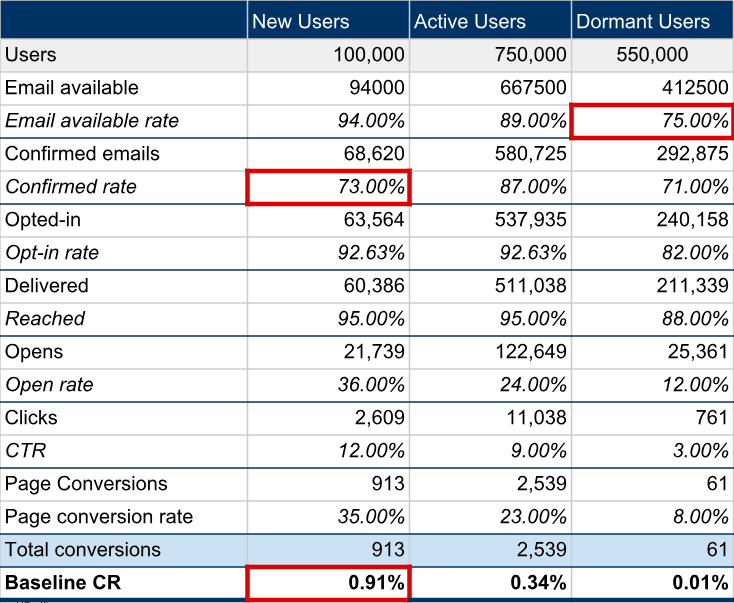
So in this hypothetical example, we can see that the email available rate for dormant users is significantly lower than for new and active users. This suggests that somewhere in the lifecycle or for a particular cohort of users, we are losing their email address and this may be contributing to them entering a dormant state. Or the confirmed email rate for new users is quite a lot lower than the larger pool of active users. Has something happened recently that is contributing to this decline? And when we look at the baseline conversion rate for the page conversion, does this seem low given the expectations for the channels performance or industry benchmarks?
Use case 2: Helps project reaching targets
I don’t know how many of you have been in this situation (I know I have) — your marketing team is handed down some sales or business targets from the executive level and you’ve just been told to hit those targets. They’ll say, well we can convert 2% of users and we have 1m users. Simple right? Not so much. Hopefully, your company doesn’t do that and you actually work out your targets based on what your channels are already delivering, but for those that work somewhere that do, this is going to help.
Even if that’s not how your company sets targets, you need to know whether email can help you hit a seasonal campaign or quarterly target for example. Because unlike performance marketing, we can’t just keep spending spending spending until we hit a sales target. Or another example would be simply to get a certain percentage of users to activate during your onboarding. This model can help us work things backward.
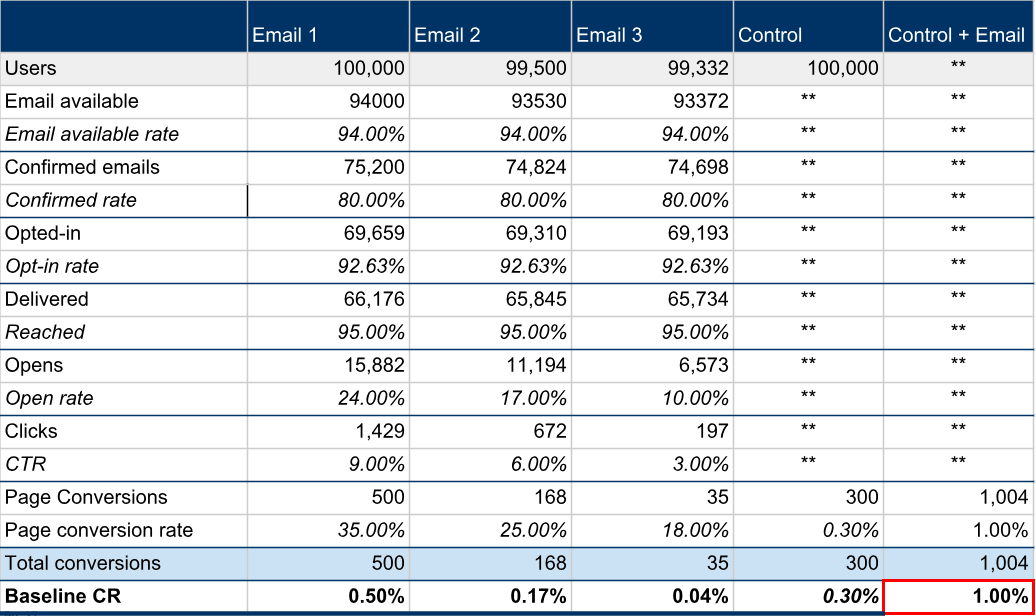
So using the multiple message frequency variation above, our aggregate conversion rate is 1%. But carrying on the hypothetical example from earlier, management has given you a target converting 2% of users for this campaign.
So based on this model, if your targets are to drive a 2% conversion rate for your campaign, you now know that you’re likely not going to hit those targets if you proceed with your current approach. You will either have to say to management that they will need to spend more on other channels to reach the desired targets, or you will have to find where in your model you can optimize to get closer to 2%.
Use case 3: Useful for ideation and brainstorming
So how are we going to achieve this target of 2%? Well, in the model diagram below I have adjusted some conversion rates that I think might be achievable in an attempt to hit our desired target of 2% of our target users. This is where we can start to ideate on how we can improve these rates and know where we might want to prioritize resources.
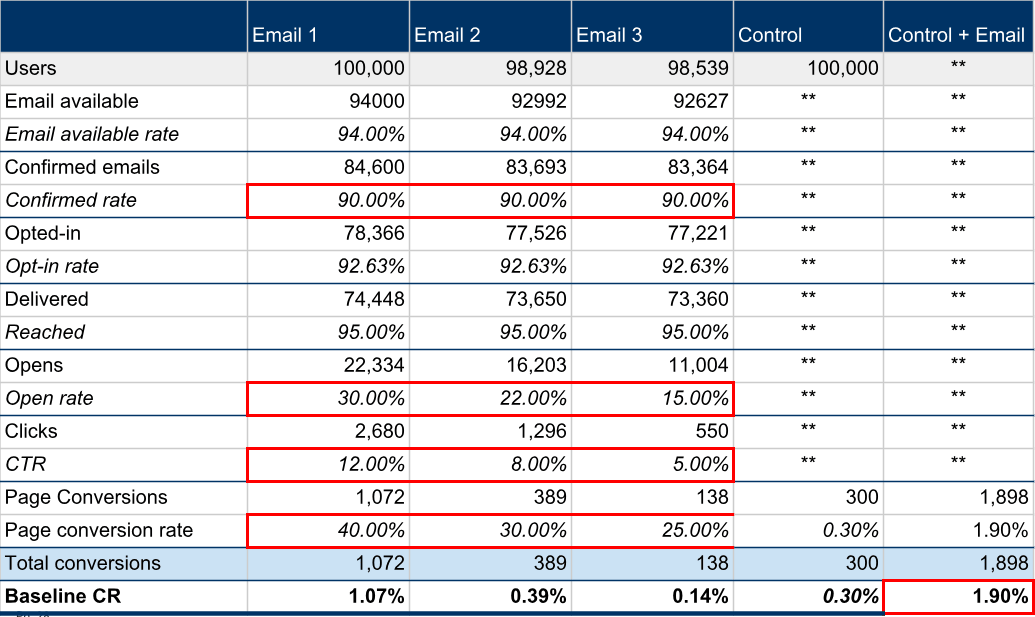
So I’ll talk through these changes. Near the top of the email funnel, we’ve spotted that only 80% of our emails are confirmed. Well in order to get that up to 90% there are any number of different things that might help us get there. Perhaps it’s just a case of people missing the first confirm your email and not clicking it due to it is not sending immediately or a delivery problem with one mailbox provider that can be fixed. Or maybe you could run an email confirmation campaign on another channel like the in-app message or push message. All these might help you get to 90%.
Further down the funnel, the notification opt-in rate and delivery rates look pretty good, so probably not much value in trying to do anything to improve those. However, if we play with the open/click/page conversion rates we can start to make some progress against our targets. So in the case of the first email, we’d need to get our open rate from 24 to 30%, our click rate up from 9 to 12%, and our page conversion from 35 to 40%. Assuming we could actually do all this, we would then be looking at an aggregate conversion rate of 1.9% which is much closer to our target 2%.
Of course, these kind of uplifts in your model are significant, so you will want to be thinking realistically about how to create these kinds of gains — either iterative gains which will take time or big swings which might be more like discount codes or wholesale changes to your product UX. Based on this hypothetical example I would want to be reevaluating the overarching strategy of how to get to that target number or use this to set correct expectations of what could be achieved over time.
The point of this exercise is to know where in the funnel you need to focus to get the lifts you need, and then ideate based on that so that your experiments have a strategic purpose.
Conclusion
In order to get the most out of a large-scale email program, you are going to have to make the effort to create an email funnel model. Using the different variations will help you achieve different goals, but all form the necessary foundation for you to identify the biggest opportunities, build an experiment and optimization roadmap and drive significant growth in your email program.
Thanks to Regina Leuwer.
Table of Contents