The Mobile Growth Stack contains a lot of information and can be intimidating at first glance. This article explains how to use the stack as a tool to assess current competencies and identify the most attractive opportunities to drive the next phase of growth for a mobile product.
The stack can drive impact and aid focus at all phases of the product lifecycle but is likely to be particularly useful once a product is live, with real users. Before launch, the emphasis is on building a product with growth fundamentals in mind. Post-launch is where the stack really comes into its own and can be used as a tool to support an ongoing growth process. We’ll cover how to apply the stack in both scenarios in this article.
If you want to check out how a mobile startup has done this in practice, read the case study by Gabor Papp from Shapr3D:
How to implement the Mobile Growth Stack at a tech startup? — Shapr3D case study
Pre-Launch: Consider Analytics & Insight From The Very Start
Most companies already have a product in existence before they start thinking seriously about growth. Until a strong product-market fit is established, attempting to scale growth is risky, since users will not stick around in high numbers and, if they decided it wasn’t for them the first time around, they will be harder to convince to give the product a second try in the future.
These days, most digital software products are built using Lean principles; a Minimum Viable Product (MVP) is produced and is released uncomfortably early. Releasing early helps to validate the core proposition and generates valuable user feedback — both qualitative and quantitative — to inform further iterations of the product. This helps to ensure that scarce resources are allocated according to more than hunches and past experience of team members, which — while valuable — is no substitute for real-world usage data.
Teams working on early-stage products rightly focus their time and resources on nailing their Minimum Viable Product (viability being the critical measure of product-market fit).
Consideration of the Analytics Layer in the early days will pave the way for faster progress and scaling up of growth activities in the Acquisition, Engagement & Retention and Monetization layers as the product and business evolves.
A pre-MVP product team should implement minimal viable analytics in order to quantitatively measure their level of product-market fit.
This doesn’t mean that early-stage teams should spend weeks building or integrating complex analytics tools; MVP analytics can be as simple as storing a few key events in a database and manually pulling the numbers to see if engagement is increasing with each iteration. Having basic analytics in place at the outset will not only inform early product decisions and accelerate the journey toward product-market fit, but will also be helpful in convincing investors that the team understands the value of data-informed decision making.
Post-Launch: Using The Stack As A Framework For Growth
Once the product is launched and has real users, the real growth work begins. The following article indicates a step-by-step approach that can be taken to regularly review the high-level growth strategy, leading to a strategic growth roadmap.
Taking a strategic approach with some high-level guiding principles ensures the bigger picture is not lost as day-to-day tactical execution is underway. Regular periodic review (e.g. every 3 months) at the strategic level provides an opportunity to update the course based on results of initiatives and changing external factors.
The following process may prove useful in conducting such a strategic growth review:
Start with high-level business objectives: Keep in mind what KPI is most important and direct your efforts there.
Review current growth & trends: How are the numbers developing? What can improve growth the most? (consult growth model and do scenario planning
Identify opportunities & gaps: Create a growth report card and review the report card with business objectives in mind.
Select focus areas for the next period: Select the appropriate mixture of quick wins, bigger bets and moonshots for the next stage of growth. Invest in new capabilities and channels. Execute on quick-wins and identify any additional analytics required to instrument these initiatives.
Build / Update your growth backlog: Add all of the new initiatives you identified.
Prioritize the backlog according to impact & resources
It’s important to note that growth work is an iterative process that is never complete, nor fully optimized. The same, of course, can be said for the product itself.
One tough challenge, especially with small teams, is deciding how much emphasis to allocated to product (e.g. new features, functionality or usability improvements) vs growth (sustainably growing the active user base), especially when it comes to engineering resources, which are usually the scarcest and most expensive to deploy. (Read more in our blog post about Growth vs Product Engineering) .
The following section outlines some steps that can be used to apply ‘stack thinking’ to make strategic decisions about the growth roadmap.
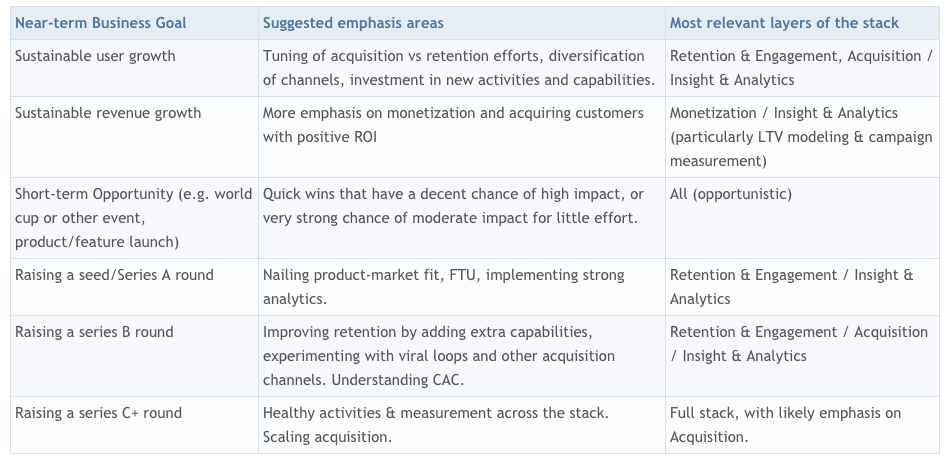
Step 1: Start With High-Level Business Objectives
Take a moment to consider what is most important for the business at this stage:
Step 2: Review Current Growth And Trends
With the high level objective in mind, take a quick health-check on your current growth rate and how those KPIs are developing over time. Pay particular attention to KPIs relevant to your objective, but not to the exclusion of others, in case there’s actually a much bigger problem going on that requires urgent remedial effort.
Note: This exercise is impossible without some analytics in place that allows you to track active users, cohort retention and user churn (basic Growth Accounting). This really is a necessity to have in place before launch.
Running through this high-level checklist provides a decent basis for creating a report card in Step 3.
- How are your metrics trending?
- Do you have enough new users coming in each week to run statistically significant experiments on new user cohorts?
- How are your cohorts developing?
- Is new user retention increasing with newer cohorts? If not, recent changes have made your product less attractive.
- What is your D1, W1 and M1 retention? How does this compare to industry benchmark data for your industry / product category?
- At what point in the lifecycle are users churning?
- Which channels & acquisition efforts are bringing in the highest-engaged users?
- What are your DAU and MAU growth rates?
- Are acquisition & retention in a healthy balance? What will drive the most user growth over the next period if you had to pick one to improve? (hint: it’s usually retention)
Note that a data-driven growth lead will ask these questions far more often than once per quarter, but it’s helpful for the whole team to take stock on at least a semi-regular basis. Next, it’s time to dive one level deeper and consider how specific activities are contributing to this top-line growth (or lack of it), by creating a Growth Report Card.
Step 3: Identify Opportunities And Gaps
Creating A Growth ‘Report Card’
Auditing the effectiveness of current growth activities and channels is a critical first step in understanding where new opportunities lie.
This high-level exercise is straightforward and can easily be completed in under an hour. The objective is not to produce a detailed quantitative analysis of every current and past growth initiative; it’s designed to be a quick health-check of what’s working, what isn’t, and what hasn’t even been tried yet. It’s essentially the first stage of a gap analysis:
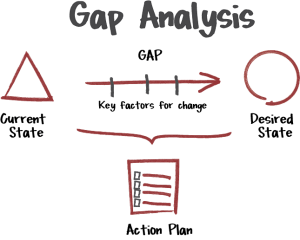
(Src = Umair Iftikhar, “Gap Analysis alignment” https://www.linkedin.com/pulse/gap-analysis-alignment-umair-iftikhar)
Elements of the stack (i.e. any activity or channel) that are irrelevant, either because they don’t fit the product/customer base or because the metrics they drive aren’t yet a priority for the business, are marked in the report card to indicate that they are not applicable at present. Well-funded consumer startups commonly aim for market share and network effects, electing to delay monetization until later on (Facebook is probably the most successful example of this strategy in action). Similar strategic choices can be made across the stack. In the early life of a product, it’s likely that the retention & engagement layer will receive the highest priority, with acquisition being important, but secondary.
Removing elements of the stack from active consideration is very liberating, especially given the number of elements in the framework, and promotes focus on the metrics most important to the business.
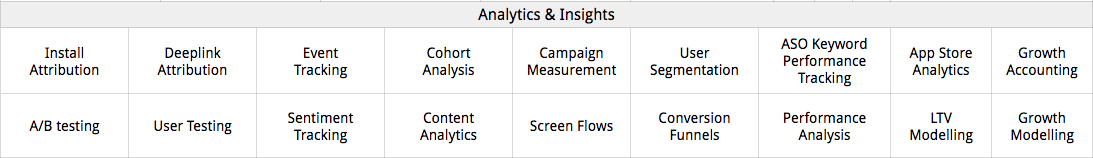
To create a growth report card for your mobile product, work systematically through each element of the stack and apply the following color-coding (or an equivalent of your choice) to each element:
Green — The activity is executing well and producing strong, measurable impact.
Yellow — The activity is executing with some difficulties, is producing weak impact or measurement is suboptimal (or some combination).
Red — The activity is failing to deliver satisfactory results, or the results are not being measured properly.
Gray — The activity is not applicable at the present time (and may never be).
Blue — More information needed. (Either because analytics is insufficient to measure impact at all, or because the opportunity to begin this activity hasn’t been fully explored)
For example:
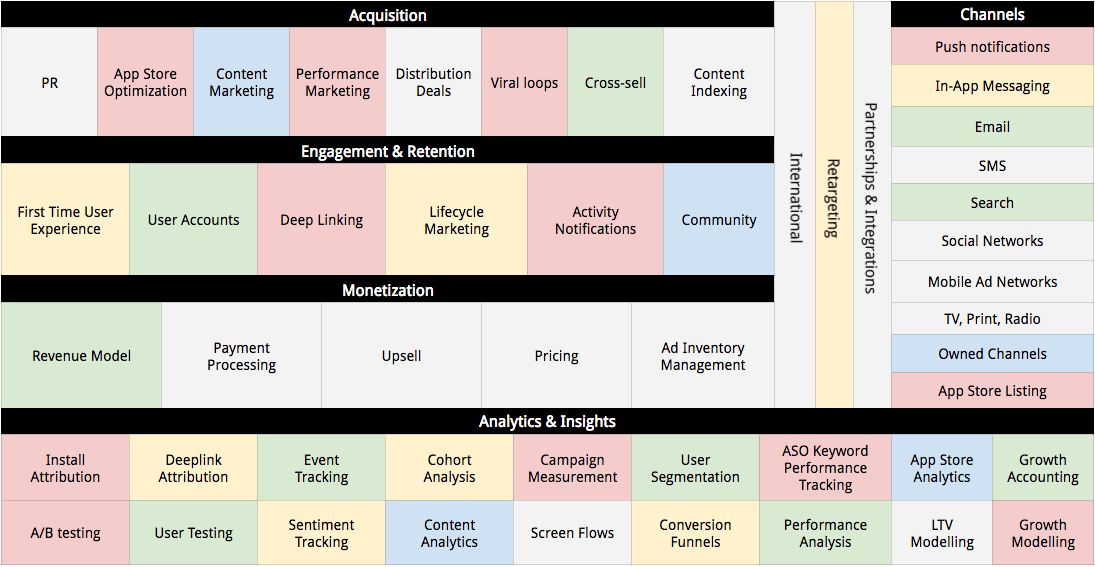
Perform this exercise for every activity and channel in the stack. Channels can be trickier since it’s possible that the same channel may be performing well — green — for one activity and red for another. In this case, mark the channel yellow, and make a note of why.
Step 4: Select Focus Areas For The Next Period
A typical report card for an early-stage product will contain one or two green cells, a few yellows and reds, and probably a lot of blues and grays. In particular, the analytics layer will have plenty of gaps (reds) that are impeding execution in the rest of the stack. As the business and product matures, the report card of should slowly fill up with greens and yellows; reds will either be improved or abandoned (becoming grey), blues will be investigated and either developed towards a healthy green, or discarded (grey).
Selecting which areas to focus on in the next period is essentially an invest/divest exercise; using the report card as a starting point, review each element with consideration of what’s working, what isn’t and what to do about them. ‘Nothing’ is a perfectly acceptable answer in many cases; reds & yellows are likely delivering at least some impact and may be considered ‘good enough for now’ while focus is placed on investing in new capabilities, or squeezing more impact out of high-performing green activities by doubling-down on them.
As with most investment decisions, it’s useful to take a portfolio approach to growth activities, combining some quick-wins with longer-term bets or investment in new channels and activities that have a chance of delivering high impact in the future. However, this isn’t always possible due to constrained resources, calendar-based deadlines, burn rates, etc. A strong growth lead or founding team will always have to make trade-offs, but should make them consciously. Green channels or activities may become less valuable over time (channels become saturated, users become indifferent) and fortune favors the bold. Bold doesn’t always pay the bills, however, and short-term growth goals may favor less risky approaches at certain times.
The following steps will help when reviewing the report card and considering where to focus. However, to seriously improve opportunity identification and judging which bets to take, a quantitative growth model that enables scenarios or initiatives to be evaluated against each other is invaluable.
Identify elements in the Analytics & Insight layer that are causing measurement problems for Red & Yellow activities: Consider what action & resources would be needed to level-up these capabilities. Investing in improved analytics will help quantify invest/divest decisions for these red & yellow activities in the rest of the stack.
Identify under-utilized or unexplored channels: can they be applied to existing activities to drive more impact
For greens: can they be ‘more green’ (i.e. is there potential for further optimization) ? If so, investing further in them will likely deliver faster impact in the near term than building new things.
For yellows and reds that are coloured as such because of poor performance, rather than poor analytics:
- Yellows: what would it take to turn yellows into greens? How much more valuable would they be if they were green? Is the impact they are driving as a yellow satisfactory for now, in light of near-term business goals?
- Reds: Why is this activity severely underperforming? Should it be paused/abandoned altogether, or do you see it as critical to longer-term success? Would hiring a domain expert, or licensing tools or technology get it onto a better track?
- For blues: What information do you require to make a better assessment on the likely impact of investing in this activity/channel? Are there benchmarks, reports, blog posts or other information resources that would assist sizing the opportunity? What would it take to create an MVP version / run a robust experiment to establish the value of this element? How long before it would be delivering impact? Could it be a quick-win that becomes a yellow or even green element in the next report card? Note: it should be expected that the MVP will require significant iteration before delivering optimal impact, though sometimes impact can be high from the outset.
- Which KPIs do you need to improve (and by how much) for you to consider this a ‘green’ activity and how much impact would it be contributing towards your top-line growth goals if it were performing at this level?
Identify products that are shining examples of ‘very green’ in each activity and seek to learn from them, or better yet, talk to someone from the team that works on the product in question who can help you understand how they got there and what impact it’s driving for them.
Identify Additional Analytics Required To Instrument These Initiatives
It’s likely — particularly for brand new activities or channels — that additional analytics will be required to properly instrument them. A practical way to ensure that this happens is to give due consideration to the KPIs a specific activity or initiative is likely to influence and to ensure that the appropriate analytics tracking and dashboarding are part of the M in MVP. In other words, always think about how you will measure impact and don’t execute anything until you can measure it!
Step 4: Build / Update Your Growth Backlog
For the focus areas identified, come up with a list of concrete initiatives. For anything expected to drive impact (as opposed to ‘infrastructure’ work such as adding additional analytics, or integrating the SDK of a new service), the KPIs expected to be impacted need to be clear at the outset.
As far as possible, some estimates of expected impact should be included with the initiative, along with the effort/resources required. This can be hard, even for experienced growth practitioners, since there are so many variables that can affect the outcome of all but the simplest of initiatives. Even when someone has experience of implementing a similar initiative in the past, the audience and channel mix, technology and implementation specifics are likely different; what worked in the past may not work as well now, or will work better if done in a new way. They are also influencing the metrics of a different product, with different engagement dynamics from a different starting point.
This is a long way of saying that nobody really knows exactly how a new initiative will perform, or exactly how much it can move the desired metrics. For this reason, it’s usually better in the planning phase to think in t-shirt sizes — Small, Medium and Large — when estimating impact and effort. This lean approach is common in software development, but can just as readily be applied to marketing initiatives such as email campaigns. Even when using t-shirt sizes, estimates will often be wide of the mark, but ideally they become more accurate over time as experience grows and learning from previous initiatives is codified.
Initiatives that you expect to drive impact can literally be anything that requires effort and time to implement. For the purposes of planning, keep initiatives high level and not too granular e.g. “Reactivation push notifications” as opposed to “Send users a push notification after 5 days to bring them back to the app”; each initiative can be individually brainstormed and developed by the team into a series of experiments.
Initiatives should be based on a strong hypothesis which ties back to team’s fundamental understanding of the product’s growth model. Initiatives should involve many experiments, each with their own sub-hypothesis. Through this approach of continually hypothesis testing, measuring, iterating, many insights will be gleaned whilst driving impact (be it positive or negative) from each test. These insights will help to refine the shared understanding of the qualitative growth model as well as inform and guide future hypothesis creation and estimations of effort and impact.
A useful hypothesis is clear about what will be changed, the expected impact of the change (the metrics will be affected and in the direction they are expected to move) and — if relevant — the time period in which the impact would be expected to occur. Hypotheses selected for testing should tie back to a bigger theme and ultimately lead to better understanding of user psychology and the product growth model.
Examples of useful, testable growth hypotheses:
“We can increase conversion to account signup by 10% by adding a Sign in with Facebook option (since it speeds up the process for users)”
“Showing trending search terms on the search page will lead to an increase in searches, leading to increased content consumption (since users may be inspired or discover new content via these trending searches)”
“Adding personalization to our re-activation campaigns will increase CTRs and re-activation rates, without significantly increasing opt-outs (since users will respond more favorably to content they feel is more relevant to them)”
When executing the initiative, care should be taken neither to lose sight of the hypothesis being tested, nor to be so myopically focused on the hypothesis and target KPIs that side effects (either positive or negative) are not missed. It’s possible that a push notification campaign targeting lapsed users delivers a fantastic short term impact on re-activation, but results in mass opt-outs from push notifications among highly engaged users. This would be at best a mixed result. Therefore, considering at the outset not just the intended KPI impact, but also the other possible metrics or user segments that could be affected.
Step 5: Prioritize The Backlog According To Impact & Resources
At the beginning of step 5, there will be a backlog full of potential initiatives. Unless this is the first time the growth planning exercise has been completed, the backlog will probably also contain planned initiatives from previous planning cycles that didn’t make it into test/production.
Assuming every initiative is sized for effort and impact, it’s a relatively simple job to order them by expected effort: impact ratio. At its simplest, this is growth planning completed: the team can start working through the backlog initiatives, starting with those that have the best ratio. In reality, it’s worth considering other factors when planning what to work on in the next period and applying some final crafting to the order of execution of backlog items. The aim should be to select an appropriate mix of initiatives that has the best chance of achieving / exceeding expectations for the near-term business goals while providing a platform for growth beyond the near term.
Consideration of the following may aid prioritization of the growth backlog:
Interdependencies: does completing a certain backlog item first make it possible / easier to work on others, either by implementing a required tech or analytics capability, or because of the expected learning and insight that it generates?
Business Goals: some backlog items from previous iterations may not be the most appropriate ones to work on in light of updated business goals.
Appetite for risk: some initiatives may have a huge upside, but be ‘moon shots’ or areas where risk is high because of lack of information or expertise, or because the technology or channel involved is very new. These initiatives are often the ones that can deliver the highest impact, but the risk of failure or mediocre performance is significantly higher.
Team morale & momentum: working only on large, long-term investment initiatives (e.g. building a content marketing program) can reduce team morale and take longer to generate learning and impact metrics. This can be mitigated by running such initiatives alongside some faster ‘quick wins’ that boost growth — but also motivation and opportunities to learn — in a short timeframe.
Parallelization opportunities: Selecting a mix of initiatives that makes best use of the people in the team and permits multiple initiatives to be run in parallel is a good way to drive impact and learning on multiple fronts simultaneously. The risk is more silo’d working within the team; regular team communication becomes more important when parallel growth workstreams are happening.
Summary
The stack is there to guide and a tool to help with strategic planning and decision making, rather than to proscribe a solution. Consideration of high level goals and use of the stack to review current and potential activities are useful pre-cursors to planning & prioritizing growth initiatives. The stack contains many more elements than can — or should — be actively worked on at any one time; first define the high-level strategy, then select the tactics & channels that are most appropriate. Iterate, measure, review and correct course accordingly.
Table of Contents