


Understanding users and their natural behavior is an important step in informing notification strategies and increasing user engagement. Tessa Miskell is a Growth Consultant within the Retention team at Phiture and works with numerous clients on all things growth related.
Often, one will pick an engagement metric (monthly, weekly, daily) based on what they think it should be (gut feel) or what they see users doing within the app. While this can be a good approach and can work well (to measure anything is better than not doing it at all), in this article I present an approach to selecting an appropriate engagement metric for an app, based on data and a bit of gut feel too.
To define an appropriate engagement metric, I focus on what’s called a user’s Natural Usage Habit (or sometimes called Usage Intervals. See this article by the team at Amplitude and this one from kaylalewkowicz.com, inspired by the team at Reforge). The Natural Usage Habit informs us of the frequency with which users naturally use the app and helps us to understand their natural behavior.
Different apps have different Natural Usage Habits. The emphasis here is on the word “natural” — we don’t want to force an unnatural or unrealistic engagement metric onto an app, nor do we want to create engagement strategies that don’t align with a user’s natural usage of the app.

For example at HomeToGo, a holiday rental app, it may be unreasonable to expect users to engage with the app daily, weekly, or even monthly as most users probably aren’t booking holidays that regularly. On the other hand, at Instagram, maybe a natural daily cadence makes sense, as the app generally requires not much more commitment than opening it and viewing your feed.
Validating these assumptions with data is critical in order to be successful growth marketers. What I’ll present below is a process for understanding users’ natural usage within an app.
I take a step back from asking “what should my engagement metric be?” to asking:
“How are my current users engaging with my app?”
I approach this by approximating how many days within a 30-day window users engage with the app, on average. For example, if users are using the app~4 days within a 30 day window, we may approximate a weekly metric. If users are using the app ~20+ days within a 30-day window, we may approximate a daily retention metric.
When completing this exercise with our clients at Phiture, we go further by looking at possible user personas and segmentations. For example, exploring the Natural Usage Habits of your most highly engaged users versus your casual users. We also consider the definition of an “active user”, as maybe app open isn’t enough to indicate good engagement. Perhaps we actually want users to perform a certain action within the app like listening to a song in a music streaming app, or performing a training exercise within a fitness app. However, for the sake of simplicity, the method outlined in this article focuses on all users and just on app open, though I encourage you to think about additional segmentation approaches and which user actions you consider most relevant.
Finding the Natural Usage Habit
Hopefully, you have a good analytics tool in place or can access behavioral data from a data warehouse. In this example I used Amplitude. We use Amplitude a lot with our clients and find it to be a strong and effective app analytics platform.
The choice of tool you use is less important than the method. Most analytics solutions should allow for similar analysis, or at least provide data export to enable this analysis to be performed manually in a spreadsheet.
The first thing to take into consideration is how new users may skew Natural Usage Habit results. The reason for this is that with most apps (read: all apps!) we see a massive drop in retention in the days after a user is first seen.
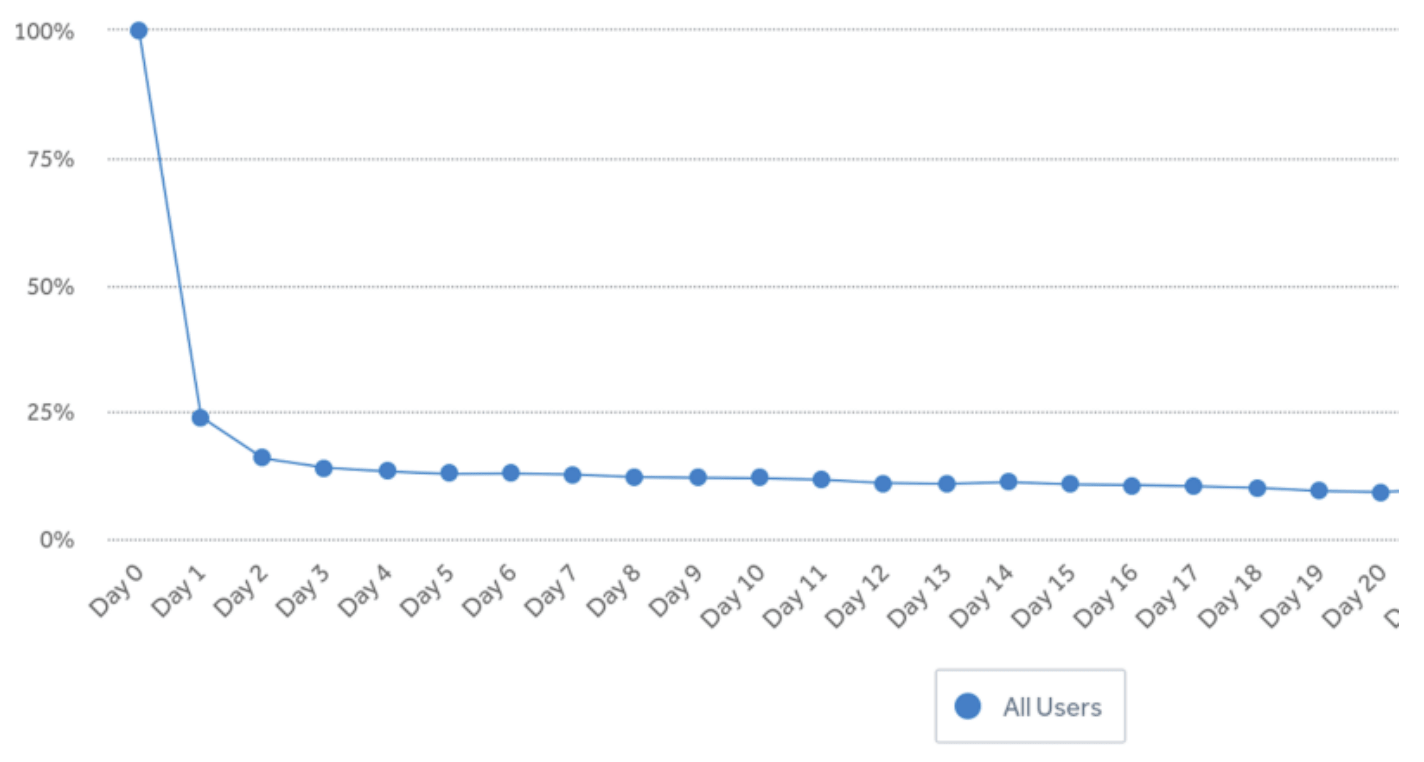
This is a typical retention curve for most apps.
Here, there is a ~75% drop-off within the first day. If these new, unretained users are included within our natural usage analysis, we will see many users who use the app just one or two days out of thirty, which could skew the analysis. These are not the users I am interested in (for this exercise anyway), so I excluded these transient installers.
I want to focus on users who have developed some kind of habit with the app. For some apps, users who are still active after a week will be considered habitual users, whereas in other apps active users may be defined as those who have completed onboarding and performed some important actions (like streaming a song or saving a watchlist, etc.). This requires some exploration of the users and some gut feel, but for simplicity here I decided to explore the usage of users who are at least Week 1 retained.
To do this within Amplitude is really simple by creating an Unbounded Weekly Retention chart, calculated by 7-day windows. I want to look at users who are more than 30 days old, so they have at least a full month’s worth of data that can be analyzed, so make sure date ranges look back far enough.
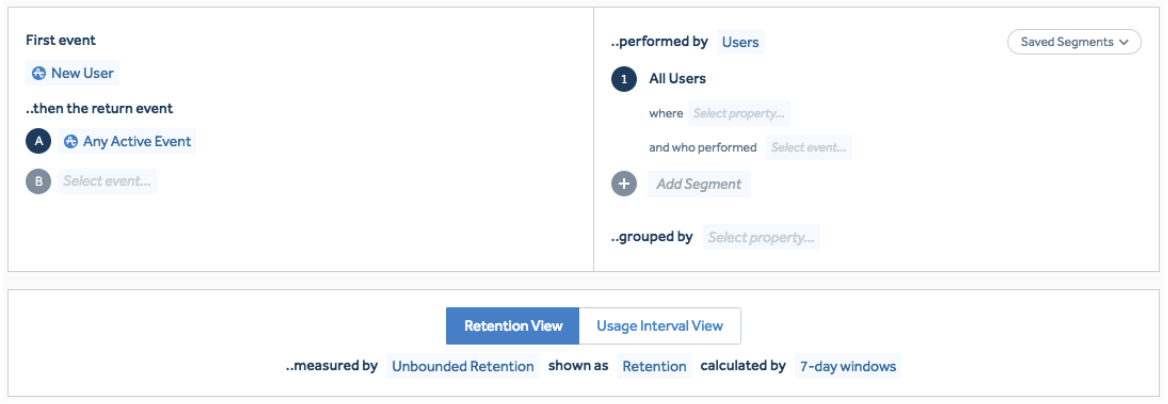
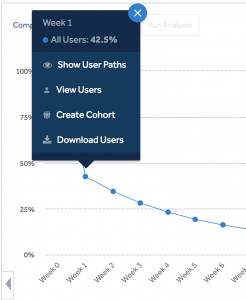
I then create a cohort of users who are at least Week 1 retained that can be used for further analysis. Heads up: you cannot create cohorts on the Free Amplitude plan, but you should still be able to perform some variation of this analysis, which I will explain below.
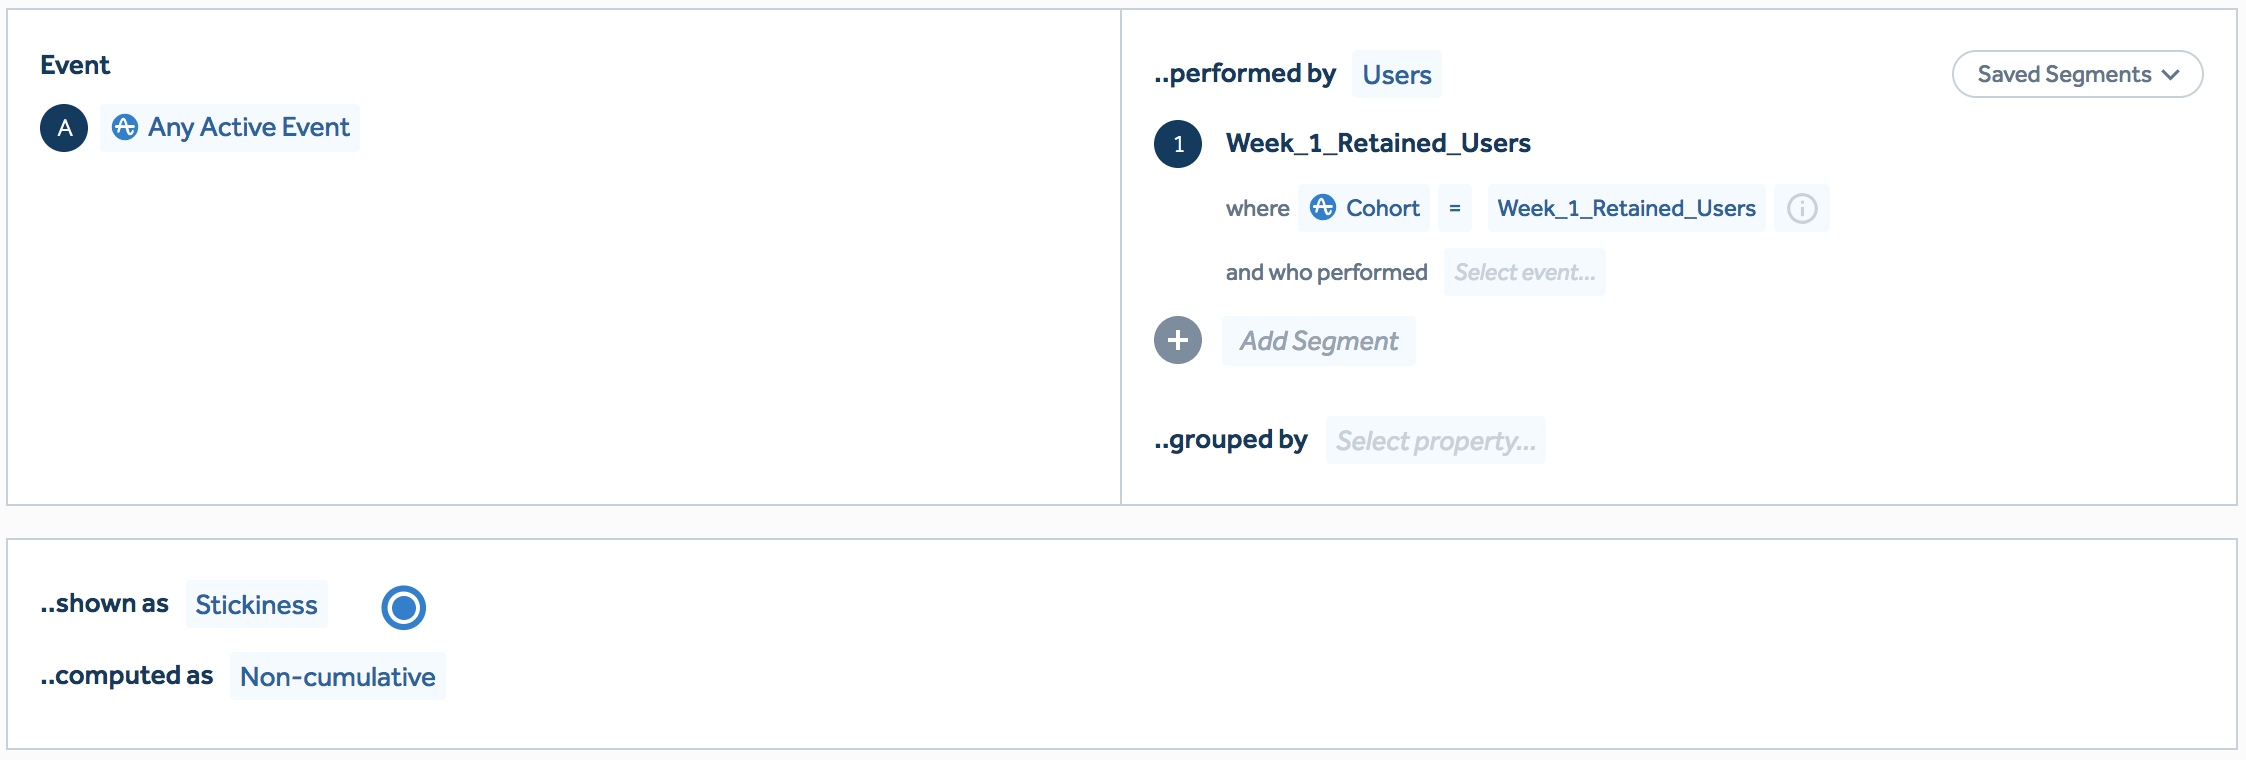
Now that I have a cohort of users who are somewhat engaged with the app, I want to know, out of a 30-day window, how many days these users are active on average. This will help to approximate the app’s Natural Usage Habit.
Amplitude’s Stickiness chart lets me perform this analysis. For this example I wanted to look at any event that a user may perform, so for the Event, I selected “Any Active Event”. I then selected the Week 1 retained users as my cohort and selected “shown as Stickiness” and “computed as Non-cumulative”. If you are on Amplitude’s Free plan, then you won’t be able to select a cohort here. Instead, you can play around with the user properties and actions and approximate this cohort of retained users by looking at those who were not new in the past 30 days but performed a certain number of actions within the last 30 days.
I selected a monthly time frame and histogram view and got a histogram like this:
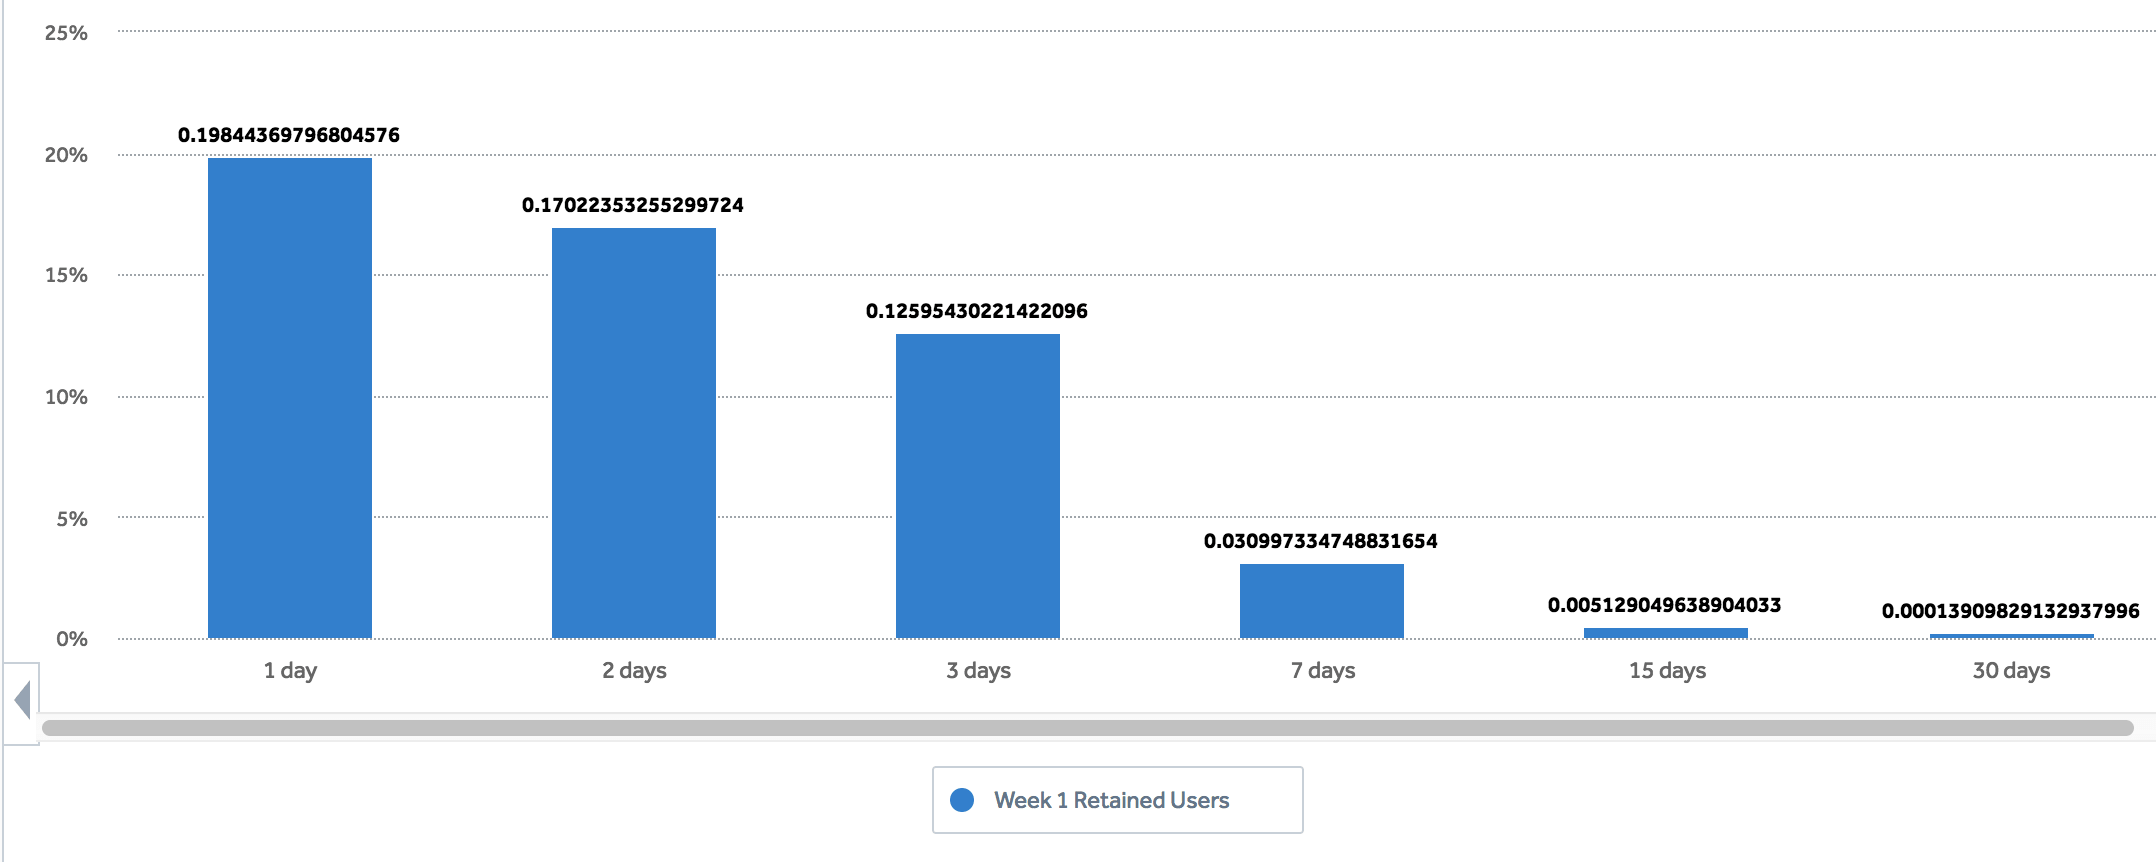
In the above example, we see that 19.8% of users engage with the app only one day within a 30 day period. 12.6% of users engage with the app three days within a 30 day period.
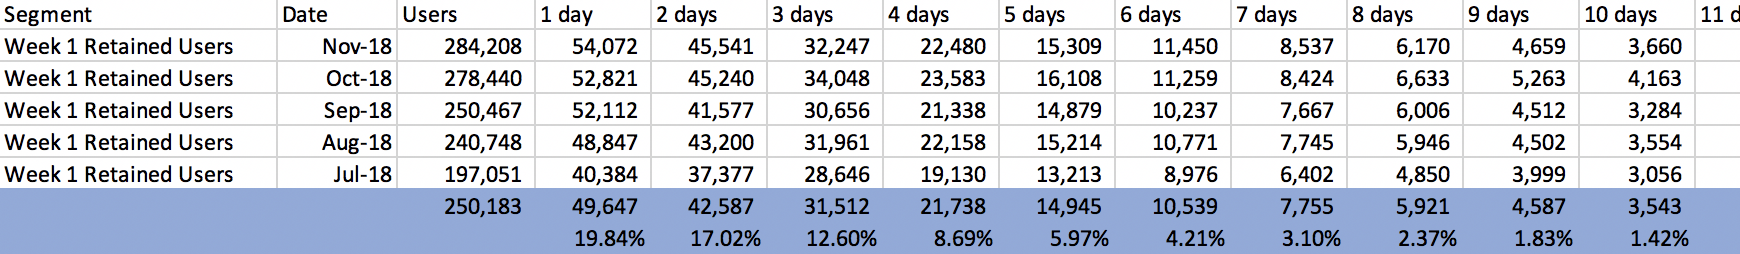
I then exported the data to CSV to get a more granular view.
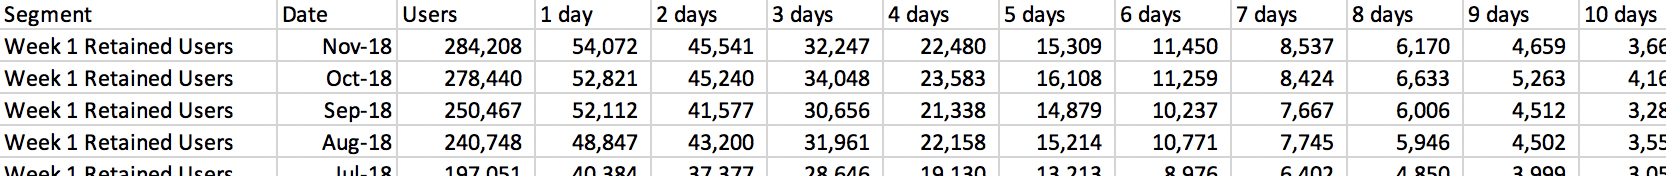
Next, I averaged each column to find the number of users who engaged with the app one day out of thirty, two days, three days, etc. across all the months. I then used these averages to calculate the percentage of users who used the app one day, two days, three days, up to thirty days.
I then created a histogram of the averages (can also use the percentages here) in order to visualize clearly how the users’ usage is skewed.
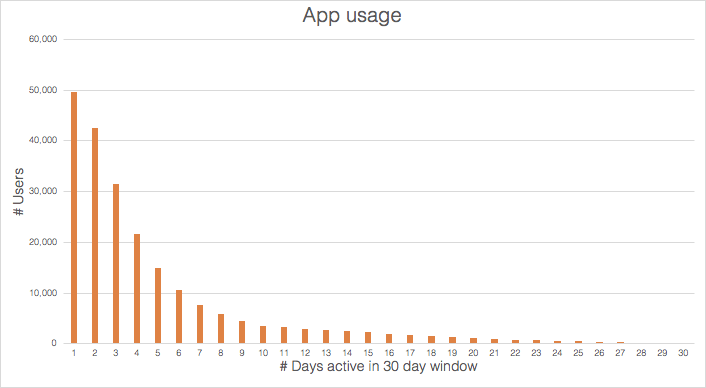
This plot is skewed to the right, with ~40% of users engaging with the app 1 or 2 days out of a 30-day window and less than 3% engaging with the app 20 or more days out of 30. This means that we’re most likely looking at a monthly Natural Usage Habit, and at the very best fortnightly. We can conclude that a daily or weekly engagement metric is not the best metric to look at right now.
This shows us what the users are doing now, and can help us define realistic engagement metrics. If we are looking at a weekly metric, but the data tells us that, naturally, users are engaging with the app on a monthly or fortnightly basis, this might explain the poor results seen in the weekly metrics.
An important thing to note here is that one shouldn’t get complacent about what users are doing. We should always be looking for ways to improve. If the Natural Usage Habit is monthly, but we have reason to believe this baseline could be increased to a weekly frequency through product and/or CRM initiatives, then we have work to do, and a great incentive to keep improving on the status quo.
This histogram can be used to split users up into different kinds of users: Highly engaged users make up less than 3% (20+ days). We can explore what these users are doing within the app compared to our ~40% of users who use the app one or two days out of 30. Perhaps the highly engaged users are using the app in a totally different way to the less engaged users. Maybe they’re making use of a different feature or receiving certain campaigns. We can use this information to try to guide our casual users to a more engaged state.
It’s also important to think about whether the app has seasonality and how this may change a user’s Natural Usage Habit. For example, an outdoor recreation app will have an “off-season” and an “on-season”. Try splitting the data into these seasons and see how the Natural Usage Habits change depending on the season.
What next?
Whatever a user’s natural usage is, our notifications strategy should align with this. Notifications shouldn’t be used to force users into behavior that doesn’t make sense to them as notifications can’t change behavior. Notifications should amplify and encourage natural behaviors and reinforce existing behaviors. If a user receives too many notifications this can feel like spam where users are being forced to interact with the app more than they would like which could result in them turning their notifications off, or uninstalling. If a user receives too few notifications you run the risk of users forgetting all about the app. This is the balance that we aim to strike by analyzing the natural usage of users. We want users to form a habit with the app by creating a notification strategy that aligns with their Natural Usage Habits.
Too many notifications feel like spam.
Too few notifications and users forget about your app.
Final thoughts
Although not a perfect science, analyzing how users naturally engage with an app is an important step in figuring out users’ behavior, discovering different segmentations/states, exploring core actions and how these affect users’ habits, and aligning notification strategies to users’ natural behavior.
The Retention team at Phiture are particularly interested in exploring our clients’ data and the Natural Usage Habits of their users. We help our clients use these methods — along with many other tools and techniques — to analyze user retention and engagement and to develop meaningful segmentation and CRM strategies with our clients.
Please let me know if you have any questions or comments, and if you want to discuss how we can help you, then please get in touch.